Snow depth and density revisited
Dec 2, 2009 - by Staff
Temporary impacts to NSF NCAR Road, Parking Lot and Trails
View more information.Dec 2, 2009 - by Staff
Margaret LeMone | 2 December 2009 • After my last post on snow depth and density (5 November), I wanted to do a better job of showing that snow depth decreased at least in part because the snow “settled” and increased in density. A subsequent storm on 14–15 November gave me the opportunity to make these measurements. However, the maximum depth on the ground (8 inches or 20.3 cm) was too small to easily measure the change in density through the snow column. So I opted to measure the whole snow column.
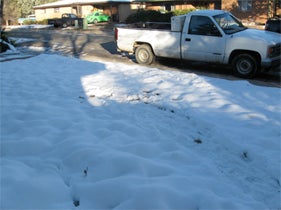 Snow-measuring site, looking northwest. The area was exposed to direct sunlight only in the early morning and late afternoon. The top of the snow had become more uneven by the time this picture was taken the morning of 19 November.
I started taking measurements a few hours before the snow stopped (around 10:45 a.m. on 15 November). The measurements were taken on the north side of my family’s house in Boulder, so that the area was in shadow most of the day (see photo). I took snow-depth measurements with a ruler at a number of locations. I collected snow for the snow-water equivalent measurements by shoving a cylindrical candy container straight down onto the grass. This technique worked best in the afternoon, when slight wetness made the snow stick together and thus stay in the cylinder when I lifted it off the ground (it was good snow for making snowballs!). In the morning, the snow did not stick together and thus some would always fall out of the cylinder when I lifted the full cylinder off the ground, despite my best efforts.
The snow was left in the covered cylinder until it melted; it was then poured into a graduated cylinder to get the water volume. The equivalent depth was computed by dividing the volume by the area of the cylinder opening. The snow depth, water content, and snow-to-water ratio are shown in Figure 1.
In the figure, the snow depth reaches a maximum of 20 centimeters at 10:45 a.m. on the 15th of November, just after significant snowfall stops. After this time, the depth decreases steadily. However, the water equivalent is steady at about 1.5 centimeters for most of the time period. The snow water equivalents have some scatter, with minima in the morning and maxima in the afternoon. From the previous discussion, the maxima are probably more accurate. Although I tried to avoid it in selecting collection sites, the unevenness in the snow depth illustrated in Figure 1 may have contributed to the scatter as well.
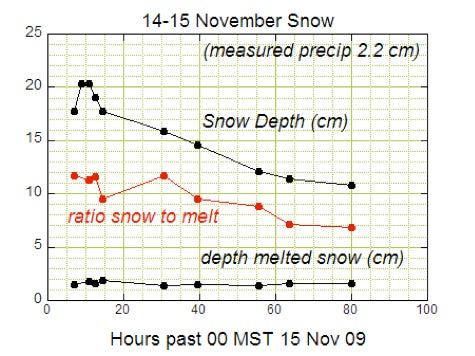 Figure 1. Snow measurements as a function of time.
The snow-to-water depth ratio decreases from typical values of around 10:1 – 12:1 to values more like 7:1 by the end of the period. This translates into an increase in density (Figure 2). Since the amount of water changed little, we conclude that the decrease in snow depth was due mainly to the snow settling or compressing with time. There was surprisingly little water lost to melting or sublimation.
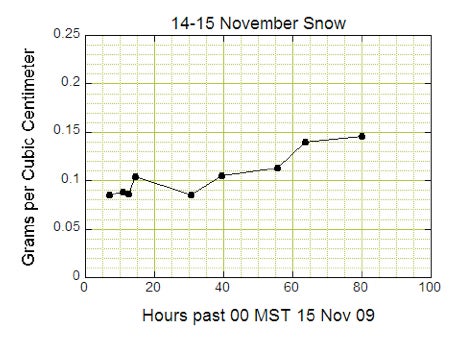 Figure 2. Density of the snow as a function of time.
This behavior contrasts greatly from what happened to the snow that was exposed to the sun on the south side of our house and on the north side of our street (see photo). In fact, there were large areas of exposed grass by hour 80 in sunny locations.
One final note: the total precipitation (2.2 cm) measured using our two rain gauges exceeded the highest water-equivalent value. This was at least partially due to the fact that the precipitation started out as rain. The table below shows the actual measurements.
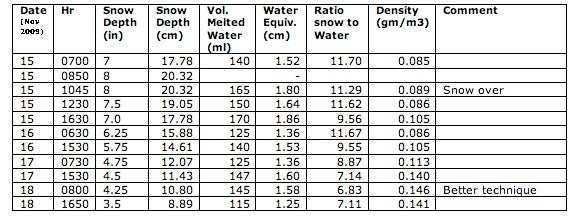 Table 1. Snow measurements for 15-18 November 2009 at the north side of our house.