Tornadoes, microbursts, and silver linings
How the Jumbo Outbreak of 1974 helped lead to safer air travel
Apr 1, 2014 - by Staff
Apr 1, 2014 - by Staff
Bob Henson • April 1, 2014 | It takes a sharp eye to find something positive in the wreckage of the worst swarm of U.S. tornadoes on record. Ted Fujita had just such an eye, and millions of Americans are safer in the air because of it.
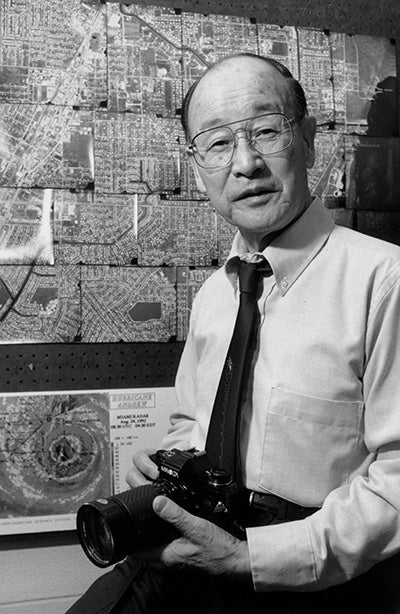
Theodore "Ted" Fujita was renowned for his meticulous work in observing and analyzing meteorological phenomena, including tornadoes and microbursts, through photographs and damage surveys as well as weather data. (Photo courtesy University of Chicago.)
Fujita, who died in 1998, is known around the world for devising the Fujita Tornado Damage Scale, or F-scale. Now reworked as the Enhanced Fujita Tornado Damage Scale, it’s the system most commonly used to rank tornado strength based on observed damage. A prolific researcher, Fujita made many other contributions to meteorology that are less well known to the public. One standout is his conceptualization of microbursts, the small yet dangerous pockets of descending wind that even weak showers can produce.
Fujita and colleagues at the University of Chicago joined with NCAR researchers in the late 1970s and 1980s in definitive work that clarified the danger posed to aviation by microbursts. The effort was a spectacular success—and it all started in the wake of a devastating round of tornadoes that struck 40 years ago this week.
On April 3, 1974, the U.S. South and Midwest were raked by more than 140 tornadoes that killed more than 300 people. The sheer scope of this disaster, which Fujita dubbed the Jumbo Outbreak (it’s also referred to as the Super Outbreak), went beyond anything previously measured. Since then, the only comparable event was the rash of more than 300 tornadoes across much of the eastern United States on April 25–28, 2011, again killing more than 300 people.
While conducting an aerial survey of damage from the Jumbo Outbreak, Fujita—already known among peers as a meticulous observer—noticed something strange. He recounted the experience in a 1985 monograph, The Microburst:
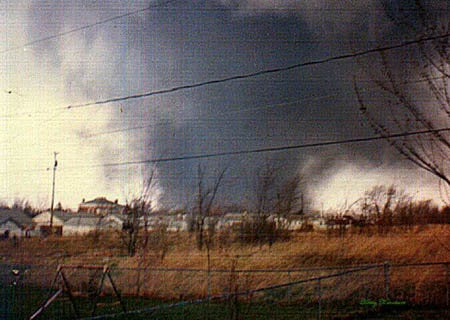
The deadliest single tornado of the Jumbo Outbreak on April 3, 1974, plowed through Xenia, Ohio, killing 36 people. (Wikimedia Commons image.)
“Unlike the swirling patterns of fallen trees, commonly seen from the air in the wake of tornadoes, hundreds of trees were blown outward in a starburst pattern. Trees near the starburst center were flattened or uprooted, spattered by a brownish topsoil.”
Fujita reasoned that such damage was produced not by the inflowing, rising air in a tornado, but rather from a focused surge of descending air that suddenly diverges when it hits the ground. He likened this to flow from a garden hose. If the hose is pointed directly downward, the water will spray outward in all directions, but if the hose is angled just slightly, the water fans out toward one side, much like the damage observed by Fujita.
Fujita concluded that about 15 percent of the jaw-dropping 2,598 linear miles of damage he mapped from the Super Outbreak was caused by these “outburst” winds, rather than by tornadoes.
The next critical event occurred on the stormy day of June 24, 1975, when an Eastern Airlines plane crashed on approach at New York’s Kennedy International Airport, killing 113 people. Analyzing eyewitness reports and black-box data, and recalling the damage patterns he’d observed the year before, Fujita concluded that a “downburst” was likely responsible for the crash. (He later coined the term “microburst” to describe a downburst that was no more than 2.5 miles wide at ground level. See this comparison.)
As with many transformative scientific ideas, Fujita’s concept came up against prominent detractors. Most researchers at the time believed that even strong downdrafts from thunderstorms ought to weaken before reaching the surface.
Fujita also bucked convention in how he carried out his research. “The large majority of his downburst work was not published in peer-reviewed journals,” noted Jim Wilson (NCAR) and Roger Wakimoto (now NSF assistant director for the Directorate for Geosciences) in a 2001 retrospective for the Bulletin of the American Meteorological Society (see PDF). They wrote: “It is likely that [the publication process] would have been an irritating, time-consuming activity for Fujita. He probably realized reviewers would have questioned his unorthodox analysis procedures and heavy use of unstated assumptions.”
As Fujita continued to gather data through aerial damage surveys in the late 1970s, he also enlisted the help of NCAR and its pair of portable Doppler radars, which were then among only a handful available in the world available for atmospheric research. With encouragement from Bob Serafin, who managed NCAR’s observing facilities at the time (and who later became NCAR director), NSF agreed to fund a field campaign. “At a time when many in the scientific community had serious doubts about Fujita’s downburst hypothesis, these two [entities (NSF and NCAR)] fully supported his efforts,” noted Wilson and Wakimoto.
Several landmark field projects over the next decade made it clear that Fujita was on the right track.
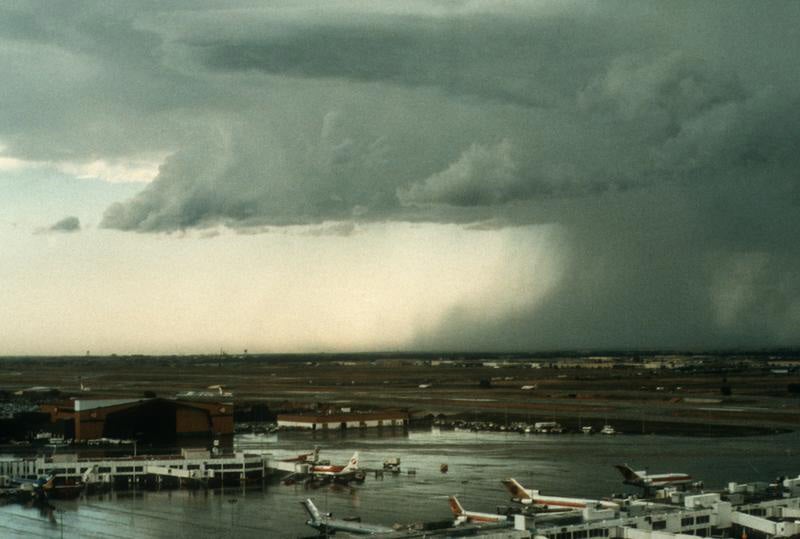
Descending air curls outward and upward as it slams into the ground in a microburst near Denver's former Stapleton International Airport on July 6, 1984, during the CLAWS project (Classify, Locate, Avoid Wind Shear). (Photo by Wendy Schreiber-Abshire, ©UCAR. This image is freely available for media & nonprofit use.)
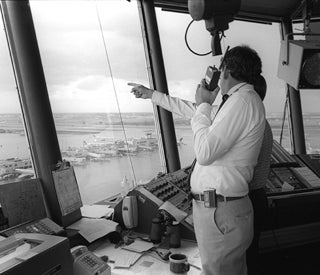
NCAR’s John McCarthy spent much of his time during the summers of 1984 and 1985 in the control tower of Denver’s Stapleton International Airport during the CLAWS project. (©UCAR. This image is freely available for media & nonprofit use.)
Results from these field projects quickly convinced skeptics that microbursts were a bona fide threat to aviation. This initial awareness helped pilots and air traffic controllers stem the rate of major microburst-related accidents, which had been occurring every year or two in the 1970s and early 1980s. More intensive pilot training, much of it initiated by NCAR’s John McCarthy and sponsored by the Federal Aviation Administration, cemented the new concepts.
Technology also made a huge difference. Building on research led by McCarthy, and with FAA support, NCAR teamed up with the Massachusetts Institute of Technology’s Lincoln Laboratory to develop software that generated wind-shear alerts, drawing on observations from surface weather stations near airports and a new network of airport-based Doppler radars. As the new tools and observing systems spread nationwide, microburst-related accidents became increasingly rare: the last major U.S. flight mishap attributed to wind shear occurred in 1995. RAL is still actively helping international governments and airport authorities procure wind shear systems.
“The microburst/aircraft problem demonstrated how funding focused on a particular weather problem can lead to an operational solution,” says Wilson.
It’s likely that hundreds of deaths have been avoided thanks to Ted Fujita’s uncommon insight, his exhaustive documentation, and the careful field work carried out by NCAR scientists and their collaborators. Many of them remain active in research, savoring the microburst success even as they look to new areas where knowledge and technology can make transportation safer and more efficient. Much of this work now takes place within the framework of the FAA’s NextGen initiative, a comprehensive approach to aircraft navigation, weather information, and safety.
Turbulence remains a vexing aviation problem. Even with no thunderstorms nearby, severe turbulence injured 11 people (two seriously) in February aboard a United Airlines flight en route from Denver to Billings, Montana. To date, around 200 United and Delta aircraft have tested an NCAR-developed system that automatically diagnoses turbulence and creates global maps of turbulence intensity. Southwest Airlines is expected to join the system later this year. Another NCAR software package uses Doppler radar data to remotely detect turbulence related to thunderstorms.
Icing is another long-recognized hazard that’s being partially tamed by technology. An NCAR-developed system, now marketed by Vaisala, allows airports to monitor snowfall rate and other weather factors crucial to aircraft de-icing as they unfold. Two products developed at NCAR use current observations and short-range computer models to map out where in-flight icing conditions are expected to be most likely and most severe, both now and over the next 12 hours. NCAR is also collaborating with NOAA on a prototype system that would provide a global picture of predicted icing severity.
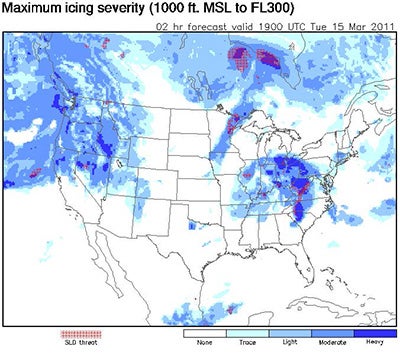
This graphic display from the FIP-Severity software program depicts a two-hour icing severity forecast across the United States on March 15, 2011. The forecast is for a column extending from 1,000 to 30,000 feet above mean sea level. The shades of blue denote the level of severity, with dark blue indicating heavy icing. The red areas of "SLD threat" are warnings for the presence of supercooled large drops, an indicator of severe icing potential. Icing can create a significant hazard for some types of aircraft. (Image courtesy NOAA/NWS/ADDS.)
Even though U.S. air travel is safer than ever, passengers can still encounter major inconvenience with long delays and cancelled flights. A new NCAR-based tool for air traffic awareness could help give airlines a probabilistic sense of where, when, and how many flights are likely to be hindered by thunderstorms. The system converts output from high-resolution computer forecast models into estimates of how much airspace capacity might be reduced—essentially switching the forecast product from weather itself to its impact on flights. The time frame of several hours into the future represents a sweet spot, with the probabilistic approach allowing for guidance beyond “nowcasting” of thunderstorms and other threats while giving traffic controllers and airlines a valuable planning window. The experimental project has been funded by NASA, the FAA, and most recently the National Weather Service.
It’s also possible that some of the next transformative breakthroughs in transportation safety will occur on terra firma. Weather-related highway accidents kill thousands of Americans each year. NCAR’s Research Applications Laboratory—which emerged after the successful attack on the microburst problem—now includes a branch focused on surface transportation. Among their current projects is a winter-weather decision support system that uses weather and road data sent by specially equipped snowplows to help determine where plowing and sanding are most needed.
When deployed on a larger scale, millions of “intelligent” vehicles might someday give drivers crucial advance notice of ice, rain, and other potential road hazards just around the bend. As with microbursts and aircraft, there’s nothing like the power of plentiful data and thorough analyses to help keep people safe from weather’s worst.