On the watch for solar superstorms
As the current solar cycle winds down, the risk of big storms goes up
Apr 30, 2014 - by Staff
Temporary impacts to NSF NCAR Road, Parking Lot and Trails
View more information.Apr 30, 2014 - by Staff
April 30, 2014 | Don’t write off this solar cycle just yet. Even though the current peak in the 11-year cycle of sunspot activity is on the weak side, the Sun might still produce a major storm at any point, spewing plasma that could disrupt power grids and satellite communications. What’s more, the waning part of the solar cycle—which we’ll experience during the latter part of this decade—is actually when the most dangerous storms are most likely.
NCAR solar physicist Scott McIntosh is raising awareness. He gave a talk at the American Meteorological Society’s 2014 annual meeting on how and why solar storms tend to cluster on either side of the solar activity cycle, with the very biggest tending to occur as the cycle recedes. McIntosh is also teaming with university and observatory partners to examine what solar flares and resulting storms tell us about the Sun’s inner workings and vice versa.
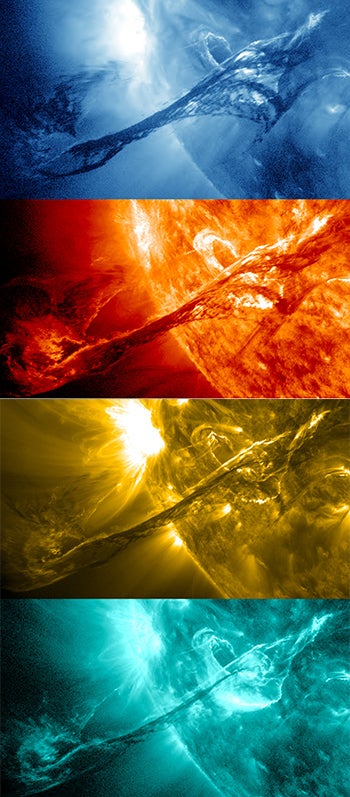
Energy from a coronal mass ejection (CME) on August 31, 2012, was captured by NASA at four different wavelengths in the extreme ultraviolet range. Traveling at over 900 miles per second, the CME gave a glancing blow to Earth's magnetosphere, leading to an auroral display on September 3. (SDO/STEREO/SOHO image courtesy NASA.)
“Lower-energy flares can occur at any phase of the sunspot cycle,” says McIntosh, “but the highest-energy flares definitely cluster.”
The Sun’s 11-year cyclic peak is tracked by sunspots, dark features on the solar surface observed via telescopes for more than 400 years. During a strong cycle, the monthly sunspot number can exceed 150. The running average for the current cycle, the weakest in nearly a century (see graphic), is now approaching its likely peak, with the latest value near 70.
Sunspots are one very visible source of space weather, serving as a rough index of the Sun’s magnetic agitation. They normally occur in oppositely charged pairs, with a twisted tube of magnetized plasma arcing from one sunspot to the other. Sometimes this plasma bursts forth in a solar flare, and on occasion a flare will eject a huge mass from the solar corona, the outermost part of the Sun’s atmosphere, into space. It’s these coronal mass ejections, or CMEs, that produce the worst space weather—especially when a CME heads directly toward Earth.
If there’s any hope of predicting how prolific a solar cycle will be, it’s in understanding bands of magnetism (rooted in the solar interior) that ooze through the Sun’s surface and migrate from high latitudes toward the solar equator. As older bands dissipate near the equator, new ones are generated near the poles. The jostling of oppositely charged bands is thought to be a prime cause of solar flares, says McIntosh, and these bands are positioned for greatest interaction when a solar cycle is on the decline.
McIntosh and colleagues are using observations from the National Solar Observatory and NASA’s Solar and Heliospheric Observatory to further diagnose what’s happening inside the Sun. Last year he and Robert Leamon (Montana State University) discovered that bright spots in the corona correlate with large-scale magnetic structures in the solar interior. “You can track back the motions of these small-scale features for 19 years, much longer than a sunspot cycle,” says McIntosh.
Right now, it’s impossible to predict well in advance where a CME will burst forth. However, knowledge of the solar cycle and its relationship to solar storms helps us anticipate periods of enhanced risk—eventually, perhaps, years ahead.
|
Writer/contact Lead researchers |
Collaborating institutions Funder |
Webcast: On The Origin of Extreme Events (16 minutes)
Scott McIntosh, American Meteorological Society Annual Meeting 2014
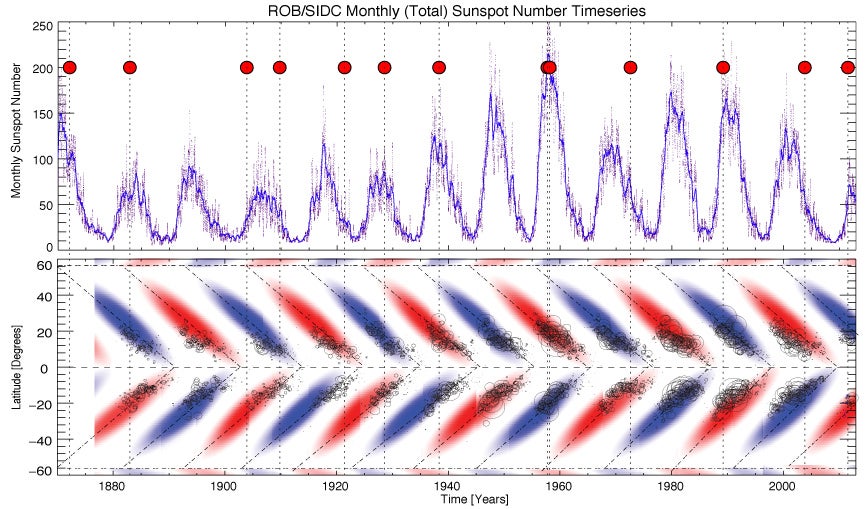
Charting the complexity of extreme solar events. This graph shows the monthly sunspot number (top) and the distribution of sunspots by solar latitude (bottom). Large red dots in the top panel mark the dates of major geomagnetic storms. In the bottom panel, the overlaid alternating blue and red bands are drawn from a conceptual model of the equatorward migration of the negatively and positively polarized magnetic activity bands that belong to the Sun’s 22-year magnetic cycle (referred to as the "fundamental" by specialists). The overlap of these long-lived bands over space and time is being used as a guide to understanding the apparently random timing and location of extreme solar events.