Looking within the min
A prolonged solar minimum gives researchers plenty to mull
Jan 15, 2010 - by Staff
Jan 15, 2010 - by Staff
3 December 2009 • If the last few years have seen a so-called quiet Sun, its silence has spoken volumes. Researchers have taken advantage of a raft of new sensors and a special observing campaign, the Whole Heliosphere Interval (WHI) in early 2008, to learn much about what happens when the sun temporarily powers down.
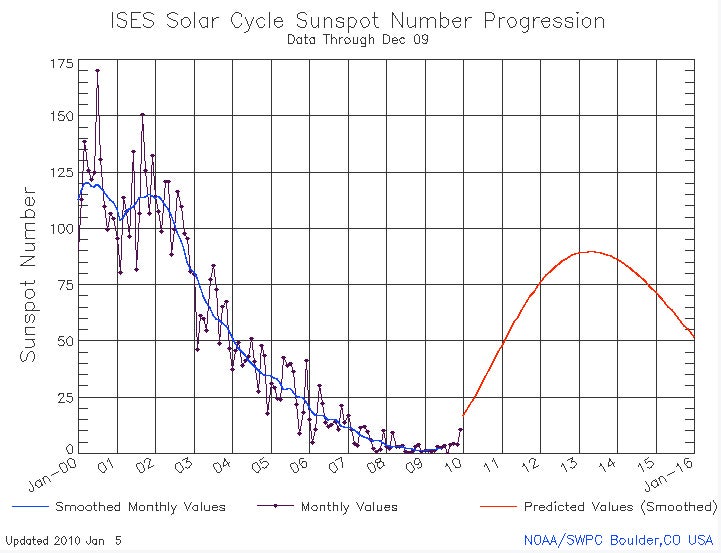
 This plot of sunspot numbers, updated monthly through December 2009, shows the measured peak of the last solar cycle in blue and the predicted peak of the next solar cycle in red. Although the average minimum occurs 5-6 years after maximum, solar activity remains well below levels observed a decade ago. NOAA's website has a larger version. (Image courtesy NOAA Space Weather Prediction Center.)
Not since the first decade of the 20th century has overall solar activity remained so low for so long. In 2007 a panel of solar prediction experts convened by NOAA's Space Weather Prediction Center (see "On the Web") called for the next solar peak (the apex of solar cycle 24) to occur around late 2011 or early 2012. However, cycle 24 has gotten off to a slow start, with only sporadic sunspots thus far. The panel now considers the next peak unlikely to arrive until at least 2013.
Along with its tardiness, the recent minimum has been unusually deep by several measures extending back at least half a century, when space-age sensing began.
 "What we think of as the quiet Sun can change from one cycle to the next," says Janet Kozyra (University of Michigan).
The good news is that data from the WHI campaign and its predecessor, the Whole Sun Month (1996), have shed light on striking differences between the most recent solar minimum and the last one. "We've learned that what we think of as the quiet Sun can change from one cycle to the next in ways that alter space weather disturbances and their effects at Earth," says Janet Kozyra (University of Michigan). However, she adds, "We don't yet know why these differences in the quiet sun occur or how to predict them."
The newly fertile topic has spawned a working group on comparative solar minima (see "On the Web") within the International Astronomical Union. The group is chaired by Sarah Gibson of NCAR's High Altitude Observatory. NCAR also hosted a November workshop on WHI results, and the December meeting of the American Geophysical Union included a special session on consequences of the unusually long and deep solar minimum.
A deceptive calm
One thing that's become clear is that 'quiet' is a relative term when it comes to solar minima. Sunspots, irradiance, and other measures of solar behavior can experience brief bursts of intensification even when the overall activity is at low ebb. This makes it tougher to determine when one cycle truly ends and another begins.
Scientists like NCAR's Giuliana de Toma refer to minima as quiet periods where cycles overlap, as one fades and another is born, rather than periods of true calm. "Solar minimum is not a single point in time, but rather an extended period of low solar activity that can last a year or longer," says de Toma. According to her analysis, the new cycle 24—which showed its first signs of activity in January 2008—has dominated over the old cycle since October 2008, while activity from cycle 23 almost vanished in the second half of 2009. Thus, the two cycles have coexisted on the Sun for over a year, but both produced very little activity, making their overlap period notably tepid.
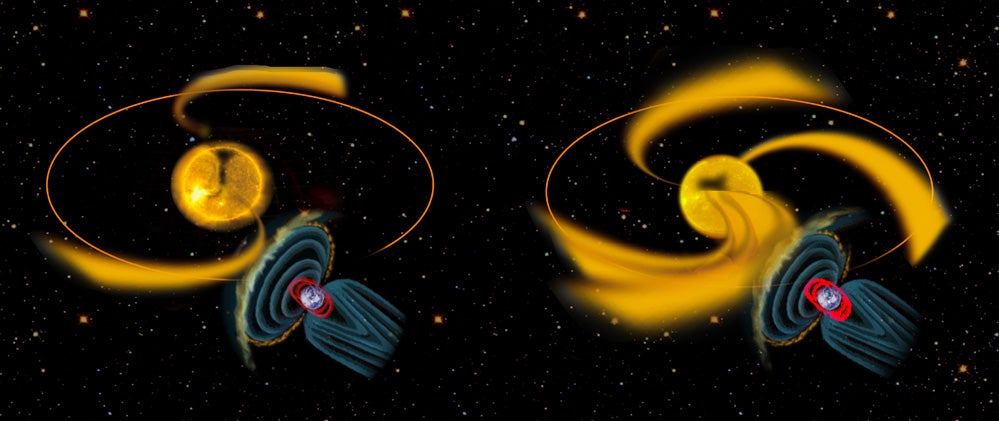
While the intense solar storms produced by coronal mass ejections (CMEs) are least likely to occur during solar minima, the Sun tends to unleash another form of magnetic havoc just as it's moving into a minimum. "The solar wind can hit Earth like a fire hose even when there are virtually no sunspots," says NCAR's Gibson. Working with Kozyra, de Toma, NCAR's Barbara Emery, and several other colleagues, Gibson used WHI data to analyze streams of charged particles shooting toward Earth from "holes" in the solar corona's magnetic field at low latitudes. The team's results appeared this fall in the Journal of Geophysical Research–Space Physics.
Although the low-latitude streams are more dilute than the bursts of magnetism and plasma found in a CME, they can last several times longer: up to 7-10 days. As a result, the collective energy they send Earth over a year's time can rival that delivered by CMEs during a year of solar maximum, according to Kozyra.
 When the solar cycle was at a minimum level in 1996, the Sun sprayed Earth with relatively few, weak high-speed streams containing turbulent magnetic fields (left). In contrast, the Sun bombarded Earth with stronger and longer-lasting streams last year (right) even though the solar cycle was again at a minimum level. The streams affected Earth's outer radiation belt, posing a threat to earth-orbiting satellites, and triggered space weather disturbances, lighting up auroras in the sky at higher latitudes. (Illustration by Janet Kozyra with images from NASA, courtesy Journal of Geophysical Research–Space Physics.)
As with CMEs, the low-latitude streams can trigger electromagnetic storms that heat and expand Earth's upper atmosphere, exerting unexpected drag on satellites and even threatening astronauts in the International Space Station. The ultimate impact depends on the orientation of Earth's magnetic field and of the stream itself, Gibson says.
 NCAR's Sarah Gibson.
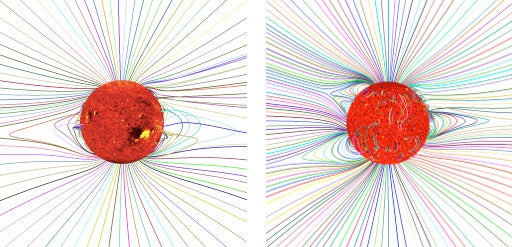
While scientists have long noted the presence of the low-latitude streams during the declining phase of a solar cycle, the strength of these streams in 2008 surprised Gibson and colleagues. She attributes their presence to unusually weak magnetic fields at the Sun's poles (see graphic). "Strong fields at the solar poles essentially clamp down on the open flux at low latitudes," she says. "This cycle had very weak polar magnetic fields."
NCAR's Scott McIntosh is working with Mark Rast (University of Colorado) and Robert Leamon (NASA) to analyze subtle variations in solar flux on the scale of supergranules. These convective cells, averaging about 20,000 km (12,000 mi) in diameter, cover the solar surface. In addition to the open-flux areas in 2008 noted by Gibson, the team has found hints that the overall magnetic flux has continued to decay to smaller spatial scales, without any "reloading" of large-scale flux to date. "We are seeing some extremely quiet Sun," McIntosh says.
What next?
Neil Sheeley (Naval Research Laboratory) puts it this way: "This is not your father's solar minimum—it's your grandfather's solar minimum." At the WHI workshop in Boulder, Leif Svalgaard (Stanford University) noted the similarity between the minimum now concluding and the one that played out from about 1895 to 1901. In both cases, sunspot counts and magnetic field strength (inferred from proxy data for the earlier cycle) took about seven to eight years to go from maximum to minimum, compared to an average of about 5.5 years. Given the precedent, says Svalgaard, "I don't think this minimum is all that special."
The solar peak that followed the 1901 minimum was on the weak side, and something similar may occur this time around, according to the prediction panel organized by NOAA. In its most recent update, issued in May, the panel predicted a peak sunspot number of 90 for cycle 24, which would place the upcoming cycle's intensity below average.
 Simulations from a magnetohydrodynamic model created by the California firm Predictive Science show the differences in magnetic structure from two days in two different solar minima. The 2008 example (right) shows more field lines emerging at low solar latitudes than in 1996 (left), opening the door for high-speed streams of energetic particles to emerge. (Images courtesy Predictive Science.)
Not all panel members agreed. NCAR's Mausumi Dikpati held to her forecast of an above-average cycle, based on a flux-transport dynamo model of solar cycle that she and colleagues developed earlier this decade.
Dikpati notes that the model predicted that cycle 24 would start as late as June 2008, while other panelists called for a start as early as 2005-06. She and colleagues are now analyzing their model output to investigate what caused the additional six to nine months' delay beyond even Dikpati's prediction.Using detailed data on north-south plasma flow collected from Mount Wilson Observatory, they've found that a vast difference in the latitudinal pattern of fluid mass carried poleward might be involved.
"It is yet to be seen how the amplitude prediction comes out in 2012-13," says Dikpati. "The last time we had a minimum this long, the cycle that followed was stronger than the cycle that preceded that minimum."
"Cycle 24 will be an exciting one to watch unfold with modern instruments," says Svalgaard. However, if it turns out to be as intriguing as the current minimum, scientists still may not know exactly how unusual it is. "Our knowledge of past activity is on shakier ground than commonly thought," Svalgaard says. Because only a few cycles have been observed in rich detail, and proxy data for earlier cycles has its limits, it's hard to know exactly what has happened before and what is truly unprecedented.
"There's a reaction right now in our community to overstating the most recent minimum as being peculiar," says Gibson. However, she adds, "I don't think you can overstate the minimum as an opportunity for discovery, especially since it has been so prolonged and so comprehensively observed."