Snowfall measurement: a flaky history
Many pre-1990 numbers would be higher using current methods
Jan 28, 2015 - by Staff
Temporary impacts to NSF NCAR Road, Parking Lot and Trails
View more information.Jan 28, 2015 - by Staff
Guest author: Matt Kelsch • January 28, 2015 | As this week’s blizzard rumbled toward the U.S. Northeast, many media outlets posted the top-10 snow events for major cities. An unusual number of snowfalls in those top 10 lists have been within the last 20 years, even in cities that have records going back to the 1800s. Why is that? Could it be climate change? Are other factors involved?
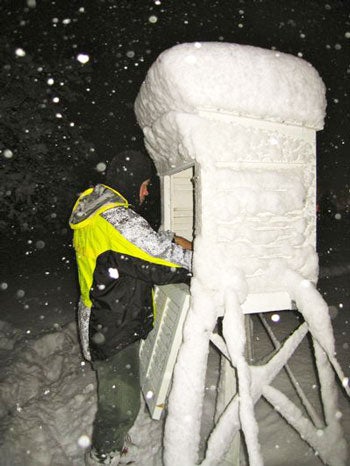
Matt Kelsch has taken 6-hourly snow readings at the official weather station for Boulder, Colorado many times during more than 25 years of volunteer work as the NOAA/National Weather Service cooperative climate observer for Boulder. (Photo courtesy Matt Kelsch, UCAR.)
As a hydrometeorological instructor in UCAR’s COMET program and a weather observer for the National Weather Service, I am keenly interested in weather trends. In this case, climate change is an important factor to explore, since we know that the heaviest precipitation events have intensified in many parts of the world (see related story: Torrents and droughts and twisters - oh my!).
But when we turn to snowstorms in the Northeast, or elsewhere in the U.S., there is an additional factor at work when comparing modern numbers with historical ones. Quite simply, our measuring techniques have changed, and we are not necessarily comparing apples to apples. In fact, the apparent trend toward bigger snowfalls is at least partially the result of new—and more accurate—ways of measuring snowfall totals. Climate studies carefully select a subset of stations with consistent snow records, or avoid the snowfall variable altogether.
Official measurement of snowfall these days uses a flat, usually white, surface called a snowboard (which pre-dates the popular winter sport equipment of the same name). The snowboard depth measurement is done ideally every 6 hours, but not more frequently, and the snow is cleared after each measurement. At the end of the snowfall, all of the measurements are added up for the storm total.
NOAA’s cooperative climate observers and thousands of volunteers with the Community Collaborative Rain, Hail and Snow (CoCoRaHS), a nationwide observer network, are trained in this method. This practice first became standard at airports starting in the 1950s, but later at other official climate reporting sites, such as Manhattan’s Central Park, where 6-hourly measurements did not become routine until the 1990s.
Earlier in our weather history, the standard practice was to record snowfall amounts less frequently, such as every 12 or 24 hours, or even to take just one measurement of depth on the ground at the end of the storm.
You might think that one or two measurements per day should add up to pretty much the same as measurements taken every 6 hours during the storm. It’s a logical assumption, but you would be mistaken. Snow on the ground gets compacted as additional snow falls. Therefore, multiple measurements during a storm typically result in a higher total than if snowfall is derived from just one or two measurements per day.
That can make quite a significant difference. It turns out that it’s not uncommon for the snow on the ground at the end of a storm to be 15 to 20 percent less than the total that would be derived from multiple snowboard measurements. As the cooperative climate observer for Boulder, Colorado, I examined the 15 biggest snowfalls of the last two decades, all measured at the NOAA campus in Boulder. The sum of the snowboard measurements averaged 17 percent greater than the maximum depth on the ground at the end of the storm. For a 20-inch snowfall, that would be a boost of 3.4 inches—enough to dethrone many close rivals on the top-10 snowstorm list that were not necessarily lesser storms!
Another common practice at the cooperative observing stations prior to 1950 did not involve measuring snow at all, but instead took the liquid derived from the snow and applied a 10:1 ratio (every inch of liquid equals ten inches of snow). This is no longer the official practice and has become increasingly less common since 1950. But it too introduces a potential low bias in historic snowfalls because in most parts of the country (and in the recent blizzard in the Northeast) one inch of liquid produces more than 10 inches of snow.
This means that many of the storms from the 1980s or earlier would probably appear in the record as bigger storms if the observers had used the currently accepted methodology. Now, for those of you northeasterners with aching backs from shoveling, I am not saying that your recent storm wasn’t big in places like Boston, Portland, or Long Island. But I am saying that some of the past greats—the February Blizzard of 1978, the Knickerbocker storm of January 1922, and the great Blizzard of March 1888—are probably underestimated.
So keep in mind when viewing those lists of snowy greats: the older ones are not directly comparable with those in recent decades. It’s not as bad as comparing apples to oranges, but it may be like comparing apples to crabapples.
Going forward, we can look for increasingly accurate snow totals. Researchers at NCAR and other organizations are studying new approaches for measuring snow more accurately (see related story: Snowfall, inch by inch).
But we can’t apply those techniques to the past. For now, all we can say is that snowfall measurements taken more than about 20 or 30 years ago may be unsuitable for detecting trends – and perhaps snowfall records from the past should not be melting away quite as quickly as it appears.
Update • January 29, 2015 | Thanks to thoughtful feedback by several colleagues, this article has been updated. Paragraph 3 now includes a description of how climate studies handle the data inconsistencies. Paragraph 9 was added to describe the pre-1950s practice, no longer in wide use, of recording liquid water content only, and not snow depth.
Matt Kelsch is a hydrometeorologist in UCAR's COMET Program. He specializes in weather and climate events involving water, such as floods, droughts, rain, hail, or snow. Kelsch develops and delivers educational materials designed for both domestic and international groups including National Weather Service forecasters, the military, the World Meteorological Organization, university students and faculty, government agencies, and private industry.