Uncovering the impacts of atmospheric waves
Scientists map changes reverberating through the atmosphere
Feb 23, 2015 - by Staff
Temporary impacts to NSF NCAR Road, Parking Lot and Trails
View more information.Feb 23, 2015 - by Staff
February 24, 2015 | Earth’s weather extends into higher regions of the atmosphere than the one we inhabit. But the influence of those regions has been challenging to chart until recently. Researchers at NCAR and elsewhere are using a range of observing and modeling tools to discern previously unmapped links between weather events in various layers of the atmosphere, with implications for aviation, GPS, and other technology society relies on.
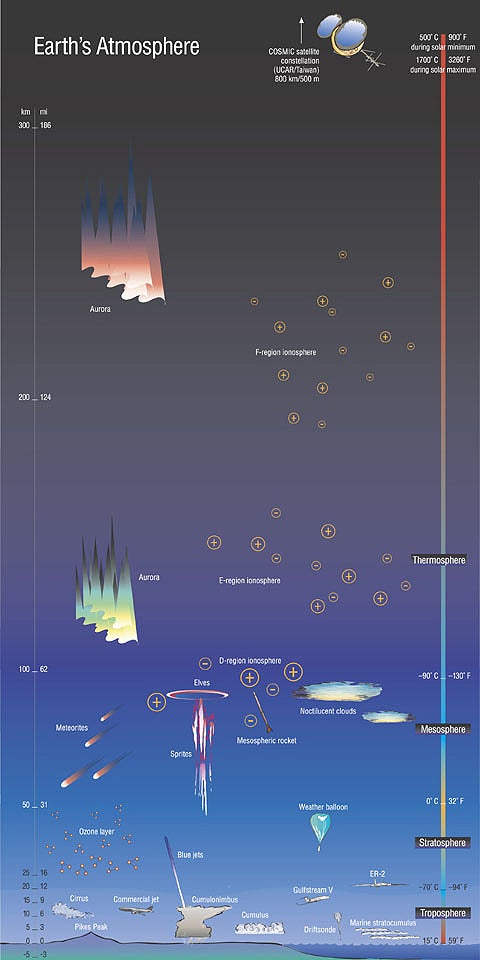
The layers of the atmosphere and a few of the objects and phenomena found in each one. Commercial jet aircraft typically cruise near the top of the troposphere, the layer nearest to Earth's surface. At the outer edge, beyond about 300 miles, lies the exosphere—the region of the thermosphere at the edge of space. (©UCAR. Click on the image for a larger view. This image is freely available for media & nonprofit use.)
A linchpin in this growing field of study is the Whole Atmosphere Community Climate Model (WACCM, pronounced "WAK-em"). Originally developed at NCAR more than a decade ago and continually refined, this sophisticated software pulls together elements of preexisting computer models of the lower and upper atmosphere into a unified whole. A special version, WACCM-X, extends out to the beginning of the exosphere (around 300 miles, or 500 kilometers), allowing researchers to simulate the rarefied realm of the upper thermosphere, where air temperatures can soar above 1,620° Fahrenheit (900° Celsius).
All of the everyday weather events that we find pleasing, annoying, or terrifying take shape in the troposphere. This is the atmosphere’s lowest layer, extending anywhere from 4 to 12 miles (7 to 20 km) high, depending on season and latitude. However, atmospheric tides, solar storms, and other phenomena play out at much higher altitudes, far from our curious eyes.
Tools such as the NCAR-based WACCM and a National Oceanic and Atmospheric Administration (NOAA) counterpart called the Whole Atmosphere Model allow researchers to replicate particular weather events and study how their effects propagate both horizontally and vertically. By comparing these simulations with observations—especially for major weather events with extensive vertical reach—the researchers are gaining further insight.
For an investigation-worthy event, it’s hard to do better than a sudden stratospheric warming. SSWs develop when large-scale atmospheric waves propagate upward and then act to compress and warm a portion of the polar stratosphere. Over a period of days to weeks, usually in wintertime, the resulting chain of events can disrupt the infamous “polar vortex,” causing it to split into two pieces and occasionally triggering dramatic cold air outbreaks in the midlatitudes.
In the stratosphere, an SSW can produce warming near the North Pole of as much as 90°F (50°C) over several days. A strong SSW can reverse the usual north-south temperature gradient in stratospheric temperature and force the winds encircling the polar vortex at this height to switch direction, with wind-speed changes of up to 50 miles per hour observed.
“SSWs were quite rare in the 1990s, but over the last decade we’ve seen a major event almost every year,” says Hanli Liu, one of the primary NCAR developers behind WACCM. This kind of multidecadal variability in SSWs also shows up when WACCM simulates long periods of climate. Scientists aren’t yet sure why the frequency of SSWs varies from decade to decade in nature or in models.
One of the best tools for observing high-altitude weather from the ground is a device known as an incoherent scatter radar. A dozen of these are now stationed at major research centers around the globe. Although SSWs can occur any time from December to March, these radars can only be coordinated for relatively short observing periods of a few weeks, usually centered on the peak of SSW season in January and February.
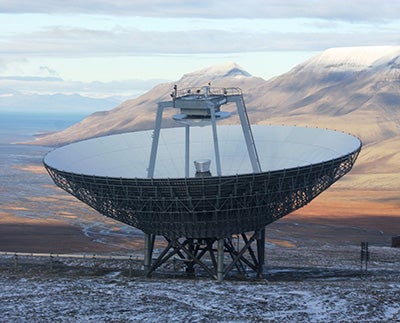
The EISCAT Svalbard Radar is one of 12 incoherent scatter radars stationed around the world. These are the most powerful ground-based tools for monitoring electron and ion conditions in the upper atmosphere. (Photo by Bjoertvedt, via Wikimedia Commons.)
Happily for researchers, several of the radars managed to capture significant SSWs in 2008, 2009, 2010, and 2013. These years span the interval from the minimum to maximum of the roughly 11-year solar activity cycle, which will allow researchers to delineate how SSWs influence the upper atmosphere under varying solar conditions (including the current, somewhat weak, solar maximum).
The observations will also be valuable data for models such as WACCM, helping the software replicate the effects that cascade from lower to upper atmosphere as an SSW evolves.
“We’re finding that if you get a solid representation of the lower and middle atmosphere, you can get a good, clear signal for the upper atmosphere,” said Liu. “It’s a step forward for space weather and ionosphere predictability.”
Nicholas Pedatella focused on high-altitude impacts of SSWs during a two-year postdoctoral fellowship based in NCAR’s High Altitude Observatory. Now a scientist with UCAR’s COSMIC Program, Pedatella continues to study how SSW impacts manifest themselves in the upper atmosphere.
“Models such as WACCM have been essential for this research,” said Pedatella. He and NCAR colleagues have pioneered the use of WACCM and related models to examine how an SSW interacts with semidiurnal tides in the mesosphere and lower thermosphere. As these tides wax and wane twice each day—powered by daily variations in solar heating and the orbit of the moon—weak updrafts and downdrafts work their way through the upper atmosphere.
Pedatella and colleagues have found that SSWs can temporarily boost the strength of some semidiurnal tides by up to 70%. In turn, these tidal shifts affect the behavior of the electrified ionosphere above, including the flow of plasma and the number of electrons.
Radio signals typically bounce off the ionosphere before returning to Earth, while GPS signals from the Global Positioning System pass through the region. Both types of signals can be affected by variations in plasma flow, electron density, and other ionospheric components. The new findings could eventually help satellite operators anticipate how the ionosphere might be affected by an unfolding SSW, thus providing a crucial heads-up for possible short-term irregularities in radio and GPS transmission.
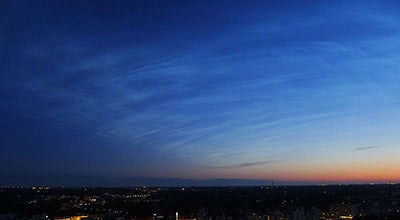
Composed of tiny water crystals at altitudes of around 50 miles (80 km), noctilucent clouds owe their existence to gravity waves that alter the polar summer mesosphere, making it the coldest region in Earth’s atmosphere. The clouds are only visible at dusk, when sunlight from below the horizon illuminates them. These noctilucent clouds took shape over Helsinki, Finland, on July 2, 2012. (Photo by Timo Newton-Syms, via Wikimedia Commons.)
While SSWs are rare but powerful, there are smaller-scale, more-frequent phenomena that also make their mark across multiple layers of the atmosphere.
Strong winds flowing over mountain ranges often generate gravity waves that propagate dozens of kilometers upward. Though smaller and shorter-lived than the planetary-scale waves that kick off SSWs, these gravity waves can still influence the atmosphere at heights of up to 60 miles (100 km).
In June and July 2014, the high-flying NSF/NCAR HIAPER research aircraft and several ground-based radars collected measurements of gravity waves arising from strong winter winds slamming into the peaks of New Zealand’s South Island. The DEEPWAVE project, involving researchers from several universities and laboratories, examined how the gravity waves evolve and how their influences can be better predicted.
“We devised DEEPWAVE to take advantage of new measurement capabilities,” said David Fritts (GAT Inc.), one of the project’s four principal investigators. “If we can use our knowledge from DEEPWAVE to better understand gravity waves arising from sources over the entire planet, it will contribute to better weather and climate forecasting in the future."
Writer
Bob Henson
Contact
David Hosansky, NCAR/UCAR Communications
WACCM collaborating institutions and funders
The Whole Atmosphere Community Climate Model is based at NCAR and developed in collaboration with members of the research community. NCAR is sponsored by the National Science Foundation.
WACCM rests unpon the common numerical framework of the Community Earth System Model. CESM is sponsored by the National Science Foundation and the U.S. Department of Energy.
DEEPWAVE collaborating institutions
German Aerospace Center (DLR)
MetService (New Zealand)
National Center for Atmospheric Research
National Institute of Water and Atmospheric Research (New Zealand)
UK Met Office
University of Canterbury
U.S. Naval Research Laboratory/Australian Antarctic Division
DEEPWAVE Funders
National Science Foundation
U.S. Office of Naval Research
U.S. Naval Research Laboratory
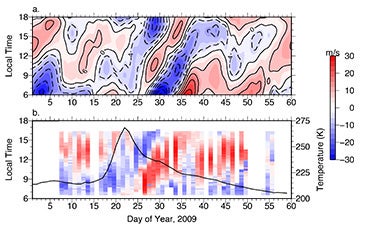
Model simulations (top) and observations (bottom) of the impacts of a sudden stratospheric warming (SSW) in January–February 2009, as shown in the vertical movement of plasma at 300 km altitude above the geomagnetic equator (Jicamarca, Peru). Speeds on the right-hand legend are in meters per second, with red indicating upward motion and blue downward motion. The black trace on the bottom panel indicates temperatures at the 10-hecopascal pressure surface between 70°N and 80°N, with a warm spike associated with the SSW in late January. The simulations were produced by an extended high-altitude version of the NCAR-based Whole Atmosphere Community Climate Model (WACCM) and Thermosphere-Ionosphere-Mesosphere-Electrodynamics General Circulation Model (TIME-GCM). (Image courtesy Nicholas Pedatella, UCAR.)
.jpg)