Weather-Maker Patterns - A World Map View
Feb 1, 2011 - by Staff
Temporary impacts to NSF NCAR Road, Parking Lot and Trails
View more information.Feb 1, 2011 - by Staff
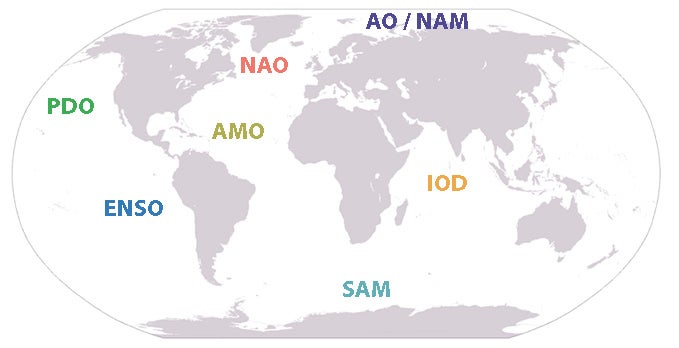
Patterns - World Map View
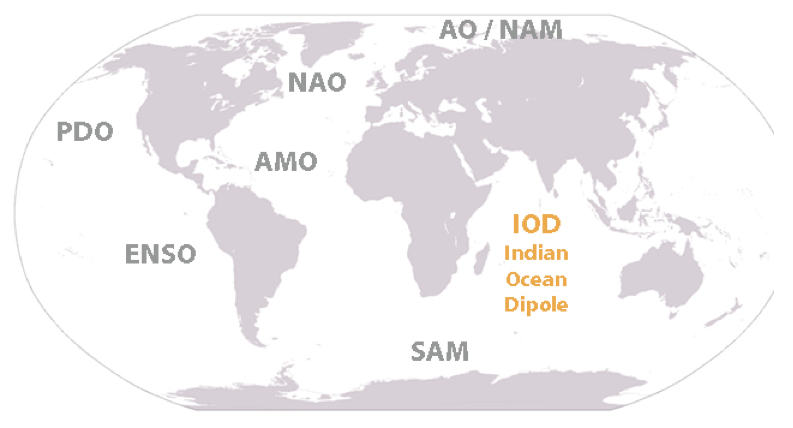
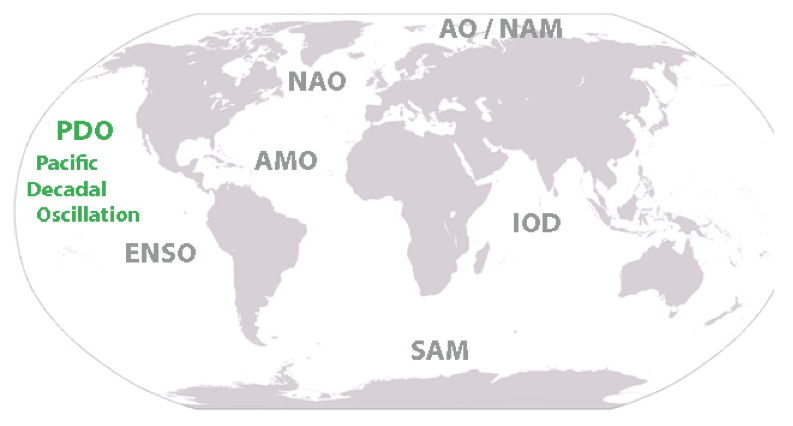
These maps show a few of the most heavily researched atmospheric patterns that shape Earth's weather and climate. Here we focus on patterns that appear as regional modes or oscillations. Many other patterns are defined in this related glossary, where you’ll also find more detail on each of the patterns described here.
What’s measured: sea surface temperatures
Timescale: 50–80 years from peak to peak
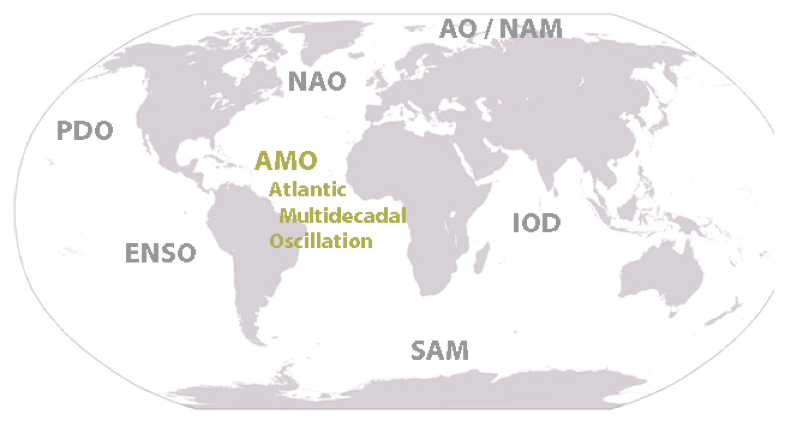
The Atlantic Multidecadal Oscillation (AMO) is a series of quasi-periodic (not completely regular) variations, each lasting several decades, in sea surface temperatures (SSTs) across the North Atlantic. Observations of this pattern go back 150 years. Atlantic hurricane activity increased in the mid-1990s as SSTs in this region climbed. The century-long temperature trend for SSTs across this ocean as well as globally has been upward as well. There has been debate over the respective roles of the AMO and human interference with the greenhouse effect in steering the course of SSTs across this area, with some researchers emphasizing climate change and others focusing on the AMO.
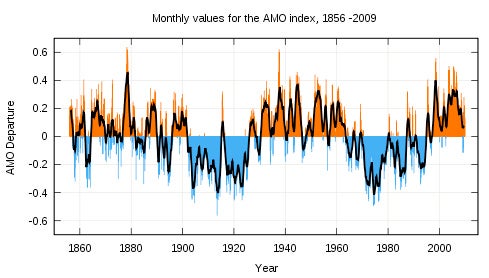
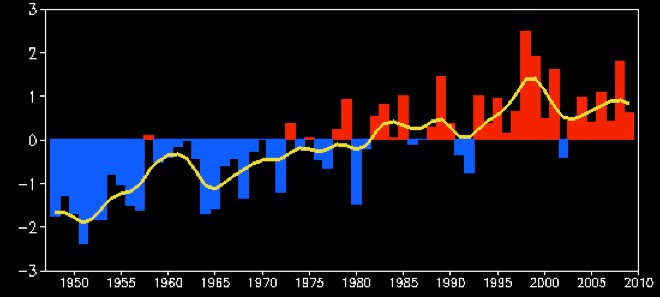
Sea surface temperatures across the North Atlantic Ocean (between 0° and 70°N) reflect a multidecadal pattern of spikes and dips, with above-average values prevalent since about 1995. The long-term warming trend of the last century has been removed from this dataset, compiled by the NOAA Earth System Research Laboratory. (Illustration by Marsupilami Rosentod, courtesy Wikimedia Commons.)
What’s measured: winds, driven by atmospheric temperature contrasts
Timescale: a few weeks to many months
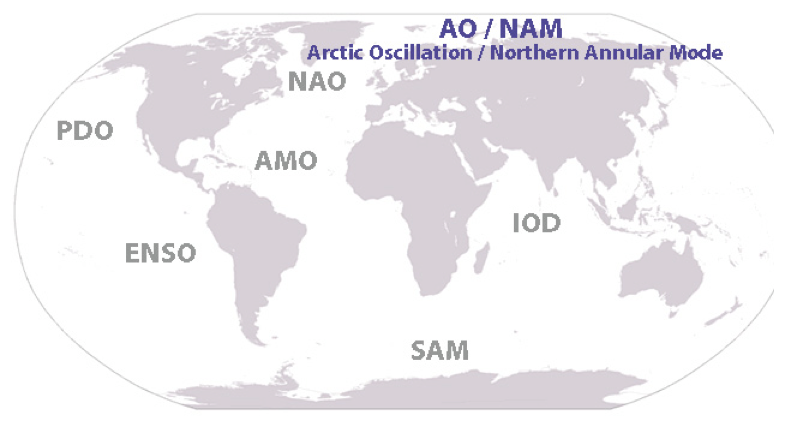
The Arctic Oscillation (AO), also known as the Northern Annular Mode (NAM), is defined by changes in the westerly winds that are driven by temperature contrasts between the tropics and northern polar areas.The annular modes generally take a circular pattern (‘annular’ means ring-shaped) and see-saw between positive and negative phases for weeks or months. In the NAM’s positive mode, the ring is stronger and further north, inhibiting Arctic air outbreaks. In the negative mode, a weaker, more variable vortex allows Arctic air to spill south more easily. The NAM is closely related to the North Atlantic Oscillation (NAO).
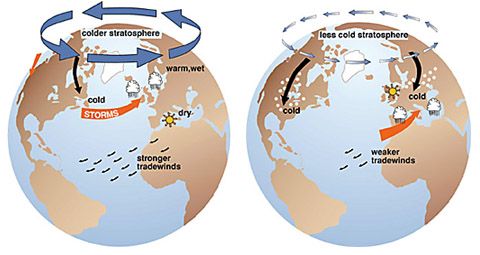
The Arctic Oscillation varies between a positive phase (left) and negative phase (right), with the negative phase more prone to outbreaks of snow and cold air across eastern North America and Europe. (Illustration courtesy John Wallace, University of Washington, and the National Snow and Ice Data Center.)
What’s measured: atmospheric pressure and sea surface temperatures
Cycle: 2–6 years from peak to peak
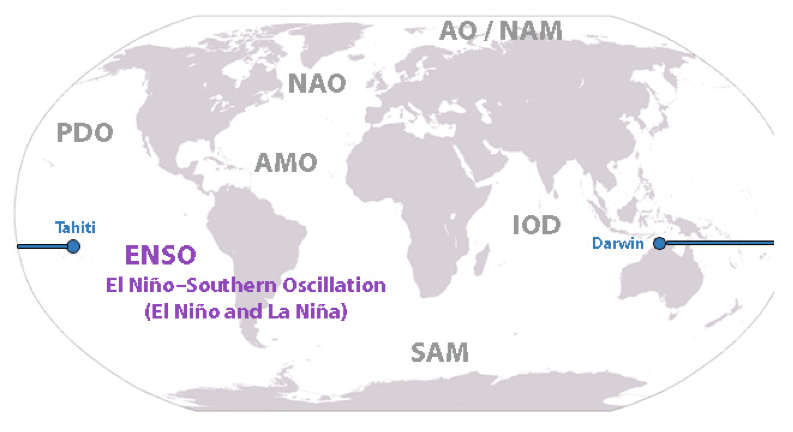
ENSO is the acronym for the El Niño–Southern Oscillation, which refers to the changing state of the ocean and atmosphere that produces El Niño (the warm phase) and La Niña (the cool phase), as well as neutral conditions. The state of ENSO is often evaluated by using
(Illustration courtesy IRI - International Research Institute for Climate and Society.)
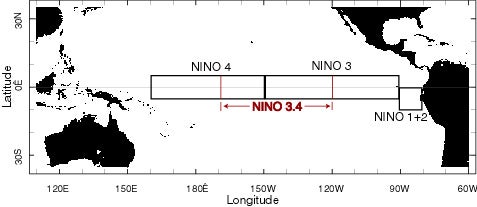
This schematic shows typical conditions across the tropical Pacific during El Niño (left) and La Niña (right) for the northern-winter months of December through February. Depicted are sea-surface temperatures (colder waters in blue, warmer waters in orange), the predominant upper-level winds, the most favored locations for showers and thunderstorms, and the location of the thermocline separating cold, deep waters from warmer surface waters. (Illustration courtesy NOAA Climate Prediction Center.)
What’s measured: winds, sea surface temperatures
Timescale: 2 or more years from peak to peak
The Indian Ocean Dipole (IOD) is a year-to-year climate pattern across the tropical Indian Ocean first identified in 1999. In the positive phase of the IOD, trade winds are stronger than usual, and cooler-than-average sea surface temperatures are prevalent across the eastern tropical Indian Ocean. To the west, near Madagascar, waters are warmer than average and convection is intensified. These patterns are reversed during the IOD’s negative phase.
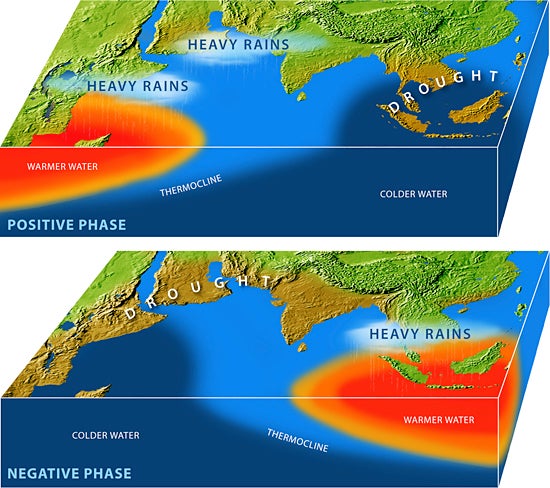
The IOD modulates trade winds and the location of relatively warm water across the tropical Indian Ocean, in much the same way as El Niño and La Niña do across the tropical Pacific Ocean. It also influences India’s summer monsoon, making it stronger during the positive phase and weaker during the negative phase. (Illustration by E. Paul Oberlander, ©Woods Hole Oceanographic Institution.)
What’s measured: atmospheric pressure
Timescale: a few weeks to many months
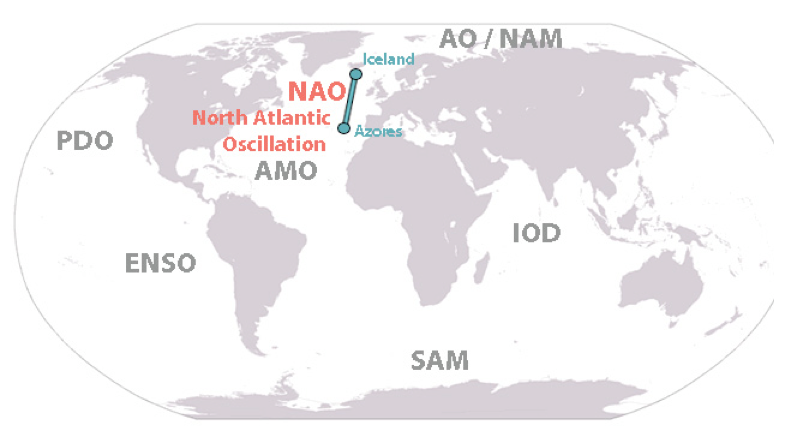
The North Atlantic Oscillation (NAO) plays a strong role in wintertime weather across eastern North America and Europe. Closely related to the Northern Annular Mode (NAM), it is typically measured through variations in the normal pattern of lower atmospheric pressure over Iceland and higher pressure near the Azores and Iberian Peninsula. Westerly winds are stronger when the NAO is positive and wetter, milder conditions predominate across northern Europe and the eastern United States. A negative NAO increases the odds for Arctic outbreaks of cold temperatures and snow in these areas.
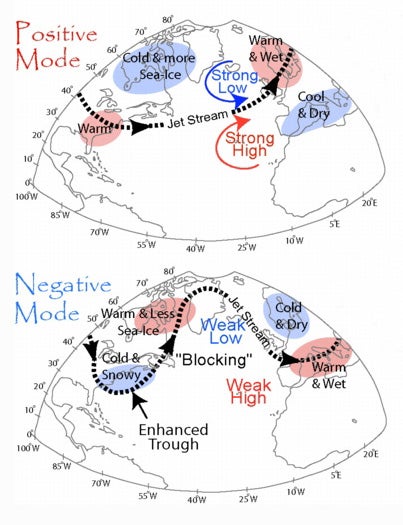
The NAO’s positive and negative modes shape weather across much of the Northern Hemisphere. The NAO can switch from positive to negative phase or vice versa in a matter of weeks, but one phase or the other often predominates in a given year, sometimes across several years. (Illustration courtesy Climate Change Research Center, University of New Hampshire.)
What’s measured: sea surface temperaturesTimescale: 40–60 years from peak to peak
The Pacific Decadal Oscillation (PDO) is a pattern of climate variability centered across the North Pacific Ocean. During the positive (warm) phase of the PDO, sea surface temperatures tend to be above average along the west coast of North America and in the eastern tropical Pacific; while across the central North Pacific they are cooler than average. The opposite patterns occur during the negative (cool) phase. Each phase typically persists for 20 to 30 years. A warm phase predominated from the late 1970s to around 2000, with the PDO moving toward cooler conditions since then. The PDO may be related to ENSO, but differs mainly because the timescale for the PDO is much longer (several decades) and because the PDO more clearly involves the extratropical Pacific and the Aleutian Low pressure system.
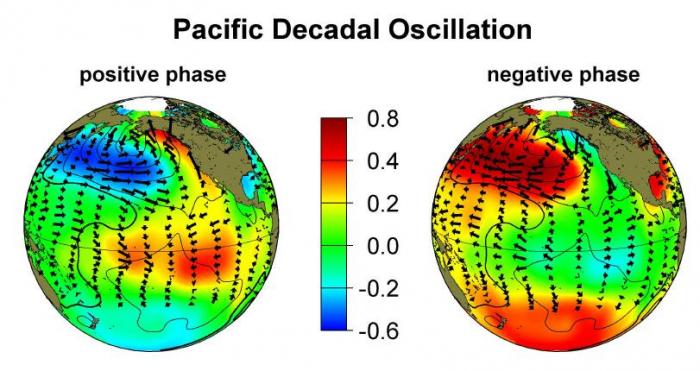
This graphic portrays typical conditions during the positive (warm) and negative (cool) phases of the PDO. Sea-surface temperatures appear in color as anomalies above or below normal, in degrees Celsius (center index). Also shown are typical departures of surface wind from their average values. (Image courtesy University of Washington.)
What’s measured: winds, driven by atmospheric temperature contrasts
Timescale: a few weeks to many months
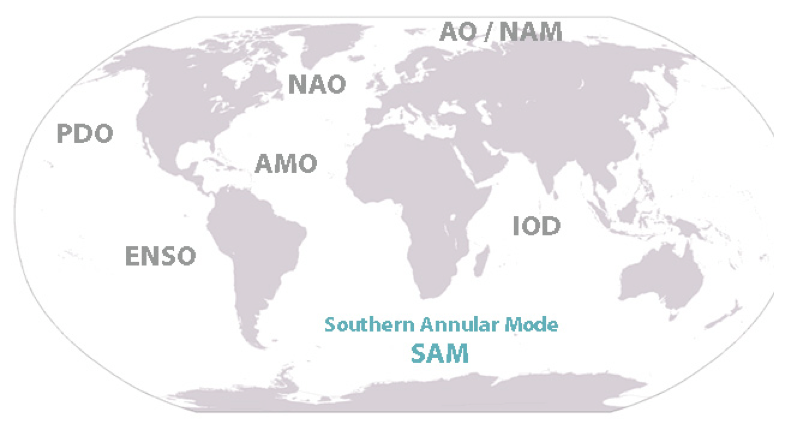
The Southern Annular Mode (SAM), which is defined by changes in the westerly winds that are driven by temperature contrasts between the tropics and southern polar areas.The annular modes generally take a circular pattern (‘annular’ means ring-shaped) and see-saw between positive and negative phases for weeks or months. In the SAM’s positive mode, the ring is stronger and further south, inhibiting Antarctic air outbreaks. In the negative mode, a weaker, more variable vortex allows Antarctic air to spill north more easily.
The Southern Annular Mode has steadily trended positive in recent decades. Computer models indicate this trend is related to ozone depletion above Antarctica and increases in greenhouse gases. (Image courtesy Jianping Li, China Institute for Atmospheric Physics.)