How deep the snow?
From rulers to lasers, plowing the way toward better snowfall data
May 6, 2011 - by Staff
Early closure on July 3 and 4 - NSF NCAR Road, Parking Lot and Trails
View more information.May 6, 2011 - by Staff
Bob Henson | 6 May 2011 • New Yorkers won’t soon forget the snowstorm of 26 December 2010. It took days for the city to recover from massive transportation snarls and other impacts. But the storm wasn’t an equal-opportunity offender. High winds led to massive drifting that left some streets with far more snow on one side than on the other. There were also big regional variations: eastern New Jersey was slammed even harder than Manhattan, with some spots reporting more than 75 centimeters (30 inches), while eastern Long Island got less than half of those amounts.
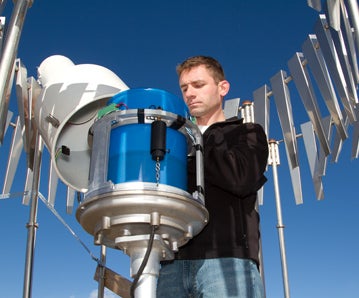
Scott Landolt oversees a variety of snow gauges and shields at NCAR's Marshall Field Site, located just south of Boulder. (©UCAR. This image is freely available for media and nonprofit use.)
The surfeit of snowfalls across the U.S. East Coast over the last two winters brought ample evidence of just how much the white stuff can vary from place to place—and how difficult it is to assess accurately.
“We’ve been measuring precipitation for centuries, but snowfall remains a challenge,” says NCAR’s Roy Rasmussen.
For more than a decade, Rasmussen and a set of colleagues have been putting a variety of snow-measuring systems to the test. Much of their support has come from the Federal Aviation Administration. With planes vulnerable to icing, the FAA needs to know how best to assess frozen precipitation at airports. Some promising new technologies are now coming into play—and just in the nick of time, too, as stakeholders ranging from climate-change scientists to emergency managers are on the hunt for better snow data.
The main playing field where snow sensors vie for accuracy under NCAR’s watch is the Marshall Field Site, located a few kilometers south of Boulder on a windswept mesa. Along with the S-Pol Doppler radar, the site hosts an array of more than a dozen automated gauges provided by various manufacturers (see photo below). The gauges each gather snowfall and measure its liquid water equivalent (the amount of melted water it contains). Each gauge is surrounded by an octagonal or circular fence comprised of narrow slats that hang 2 meters (6 feet) high. The slats block much of the wind that would otherwise toss snow crystals over a gauge instead of into it.
“Without a snow fence, you can miss up to half of the snowfall in a windy storm,” says Scott Landolt, who manages the field operations at Marshall. Adding just one fence reduces much of the bias, while a second concentric fence helps even more. On a day with winds of 8 meters per second (18 mph), a two-fence shield can reduce wind-driven snow loss by as much as 85%.
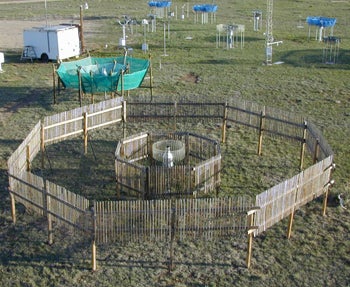
A batch of snow gauges at NCAR's Marshall Field Site—shown here on a decidedly nonwintry day—includes an example of the world's accepted standard for snow-gauge shielding, the Double Fence Intercomparison Reference (foreground). (Image courtesy Roy Rasmussen, NCAR.)
One of the standout setups at Marshall is the gold standard for snow-gauge shielding: the Double Fence Intercomparison Reference, established by the World Meteorological Organization (WMO) in the late 1990s. Marshall’s three DFIR-shielded gauges provide critical ground truth when new gauges and shielding arrays are being tested. On the downside, the DFIR is a space and resource hog. The outer ring of the double fence spans roughly 12 meters (40 feet) in diameter, a footprint that’s too large for some locations. In addition, the setup is relatively costly to install and maintain.
To achieve the best quality possible within its budget, NOAA has mandated a two-thirds-scale version of the DFIR for eventual use at its Climate Reference Network, a group of 114 stations that serve as the nation’s premier source of long-term atmospheric data. At Marshall, data from the two smaller DFIR screens are usually within 10% of the readings from the standard DFIR, says Landolt. Ongoing tests at Marshall are evaluating the option of using a somewhat smaller screen for the Climate Reference Network.
The most intense storms are still problematic, though, and in many areas these are responsible for an outsized portion of a given year’s snow. The wintry assault of March 2003 brought high winds and roughly 120 millimeters (5 inches) of liquid water and close to 80 cm (30 in) of dense, wet snow to Marshall. Even some double-fenced gauges missed more than 30% of the snow that fell. On the other hand, when snow is fluffier and lighter, it’s more likely to be deflected around the gauge. Recent work at Marshall led by NCAR postdoctoral researcher Julie Thériault confirms that low-density snow (including dendrites, the prototypical snowflake) is more affected by high wind than are wet flakes and dense crystals.
Roy Rasmussen. (©UCAR. This image is freely available for media and nonprofit use.)
The fine art of snow measurement varies greatly depending on what variable you’re seeking. In many cases it’s the amount of water in the snow that matters most. Almost a billion people across the world rely on the meltwater from snow that falls upstream through the winter and melts in the spring and summer. And it’s the water in snow—not its depth—that affects how much deicing is needed for airport operations, a result that Rasmussen and colleagues quantified through extensive work at Marshall. “It’s all glycol-based,” notes Rasmussen of the deicing fluid. “If you dilute the glycol, you compromise the deicing.”
To measure how much liquid is in a given snowfall, human observers collect snow from a gauge and melt it, while automated systems typically use antifreeze or some type of heating device to melt the accumulation within the gauge. But heated gauges can’t always keep up with high snowfall rates, which means that a cap of snow and ice can block the gauge. Also, some snow may sublimate, entering the air as water vapor before its liquid content can be measured.
Two other technologies are the snow pillow, which senses the pressure exerted on a pouch of antifreeze lying beneath the snow layer, and the hotplate precipitation sensor—invented by Rasmussen and collaborator John Hallett (Desert Research Institute)—which uses the rate of melting on a heated surface as a proxy for water content.
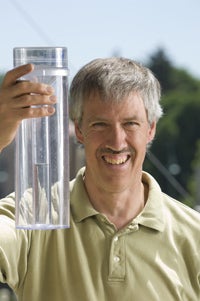
Nolan Doesken. (Image courtesy Colorado State University.)
Although the average citizen is all too aware of the weight of snow when she or he shovels, the number that grabs most public and media attention is snowfall depth. Even that seemingly simple value can be very tricky to measure, according to Nolan Doesken (Colorado State University). He’s the coauthor of The Snow Booklet: A Guide to the Science, Climatology, and Measurement of Snow in the U.S., as well as the founder of the Community Collaborative Rain, Hail, and Snow Network, which has blossomed over the last decade and continues to welcome new participants.
Through CoCoRaHS, nearly 15,000 volunteers in all 50 U.S. states measure rain, snow, and liquid equivalent and upload it to the Web each day. It’s become a vital supplement to the daily reports from NOAA’s thousands of cooperative weather observers, who also measure snow depth and liquid equivalent once each day.
Doesken’s lifelong interest in snow took a new turn in the 1990s as the National Weather Service began moving toward automated weather stations. That change introduced new uncertainty in snow measurement. As noted in a 2004 NWS report, “With the loss of frozen precipitation and water equivalent measurements of snow at many of the nation’s airports, the Local Climatological Data (LCD) record has become incomplete and/or unrepresentative.”
For example, contractors hired by the FAA to supplement the automated data at airports were measuring snow depth each hour on the flat snow-measuring boards used by all official observers. They’d then clear the snowboard and start anew for the next hour—but they weren’t required to provide the 6- and 24-hour snowfall totals that were standard for the NWS LCD records.
Because snow settles and compacts over time, notes Doesken, the sum of hourly measurements can produce daily totals up to 30% greater than a single 24-hour reading. The FAA contract observers now provide the 6- and 24 hour snowfall measurements at many LCD locations where they have access to suitable measurement locations. At the remaining LCD locations, either NWS staff or paid observers make these 6- and 24-hour snowfall measurements. The NWS has also added a second shield to the automated snow sensors at most LCD stations over the past year.
Other challenges remain in gathering the snow data that’s of highest public interest. Some of the heaviest snows in recent years—including the blizzards in December 2009 and February 2011 that gave Oklahoma City its two biggest snowfalls on record—occurred in high winds that complicated the ability to determine whether a record had truly been set. Moreover, the depth of some of the city’s historic snows weren’t directly measured; instead, they were calculated by multiplying liquid equivalent by 10, a ballpark conversion that can underestimate the depth of a fluffy, dry snow.
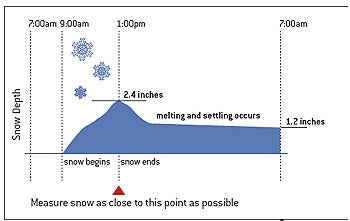
It’s critical to measure snow at the right time, as illustrated in this chart adapted from CoCoRaHS training materials. (©UCAR. This image is freely available for media and nonprofit use.)
It’s also difficult to assess record snows in places like the built-up East Coast, where spacious measurement sites are difficult to come by. New York’s Central Park is a prime example. At one point, says Doesken, a zookeeper was taking measurements in a wooded area where trees intercepted much of the wet snow. “The reality is that Central Park doesn’t have a perfect spot for measuring snow, but they’ve stabilized the record to a reasonable degree,” Doesken says.
The high-impact winter storms of the last two years have prodded the Federal Emergency Management Agency to examine its process of declaring snowfall disasters. NOAA’s Jay Lawrimore is heading up a workshop in May to help determine how best to meet FEMA’s needs. “Millions of dollars in federal assistance are at stake each time an extreme snowfall event is assessed,” notes Lawrimore. He adds that FEMA now relies on an aging snow climatology developed by NOAA in the 1990s.
This spring’s workshop, which will occur in tandem with the CoCoRaHS national meeting, is aimed at identifying methods to better address snowfall data gaps in space and time. The invited participants will also discuss enhanced observer training and expanded use of improved automated observing systems. “We also plan to dedicate some time to discussing Web-based data delivery and visualization tools, so that both historical and current observations are more easily accessible,” says Lawrimore.
In some settings, light beams and sound waves are replacing humans in measuring snow depth. Ultrasonic devices have become the state of the art across some of the world’s most wintry regions. Much like radar, these devices measure the length of time needed for a pulse of ultrasonic energy to bounce off the top of snowpack and return to the transmitter. Over the last several years, Doesken and colleagues have assisted the NWS in testing ultrasonic devices at several snow-prone locations.
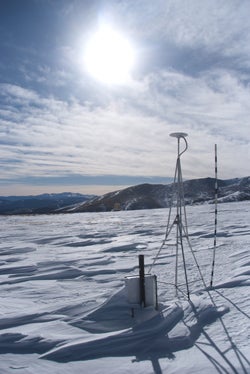
A winter’s worth of snow surrounds the GPS receiver atop Niwot Ridge, west of Boulder. Recent work shows the potential of GPS signals to measure the depth of snow and the liquid it holds. (Image courtesy Ethan Gutmann, NCAR.)
Scanning lasers can provide data similar to ultrasonic instruments over large areas, while laser-based disdrometers can measure the size, shape, and speed of falling snowflakes. This allows for an assessment of both snowfall rate and snow type while also revealing much about the source clouds. “Many countries are starting to move toward laser sensors,” says Rasmussen. He’s among the leaders of an upcoming WMO assessment of automated snow gauges.
GPS-based techniques show promise in measuring both snow depth and liquid equivalent. A GPS receiver gets some signals directly from a transmitting satellite, while other signals bounce off the snow before arriving. Through the differences between these paths, a single GPS receiver—like those now being used at thousands of locations worldwide for geological monitoring and other purposes—could in principle measure snow across a surrounding region of 100 by 100 meters (330 by 330 feet), This could help combat the perennial problem of measuring snowfall that varies widely over tiny areas.
Kristine Larson (University of Colorado Boulder) reported in Geophysical Research Letters on encouraging results from two 2009 snowstorms at the Marshall site, where the GPS-based data agreed well with ultrasonic readings. NCAR’s Ethan Gutmann is now working on an NSF-funded project to examine GPS data collected in the winter of 2009–10 at the Niwot Ridge field site, located in the foothills above Boulder. In soon-to-be-published work, Gutmann found that the technique measured snowpack as deep as 1.7 meters (67 inches) with as little as 9 cm (3.5 in) of error.
“Snow will always be a challenge to measure because of its dynamic nature,” says Doesken. “It varies in water content and crystal structure, and it melts, settles, blows about, and resists landing in our gauges, all before our very eyes. There will be an ongoing need for a combination of technological approaches to snow measurement, supported by as many local manual observations as possible by well-trained and committed volunteers.”