Dissecting Sandy’s surge
What made the high water so high?
Dec 31, 2012 - by Staff
Early closure on July 3 and 4 - NSF NCAR Road, Parking Lot and Trails
View more information.Dec 31, 2012 - by Staff
[NOTE: This is the second in a two-part post. Part 1, "Phenomenon of the year: Sandy’s stunning surge," explores communication and prediction aspects of the storm.]
Bob Henson • December 31, 2012 | Take a look at the illustration below. What do you find most striking? If your eyes are anything like mine, I’m guessing it’s how much Sandy’s storm surge (orange bar) exceeds the other top-ten surges observed since 1900 at New York’s Battery Park, near the southernmost tip of Manhattan.
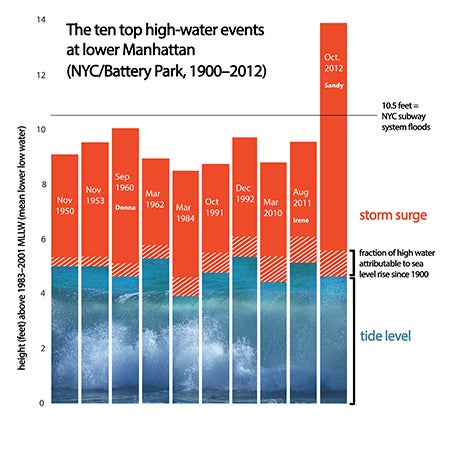 This graphic shows factors that contributed to the top 10 high-water events measured at New York’s Battery Park from 1900 to present. The water height for each event is shown here against the benchmark of MLLW (mean lower low water) averaged between 1983 and 2001. Sea level rise (about a foot since 1900) is depicted here as a component of storm surge. Although Sandy’s surge peaked close to high tide, other events had even higher tide levels. Click for larger PDF. (©UCAR. Image by Carlye Calvin and Bob Henson; data courtesy Chris Zervas, NOAA National Ocean Service. This image is freely available for media & nonprofit use.)
At 8.99 feet on top of tides, Sandy’s surge was almost twice that of its nearest rivals, which all fell between 4 and 5 feet. It was Sandy’s unorthodox westward track, coupled with the storm’s vast size, that focused and pushed such a large surge into the New York area and much of the New Jersey coast, where equally impressive records were set in many spots.
Other factors also helped push seawater to devastating heights in Superstorm Sandy. The graphic depicts three top components:
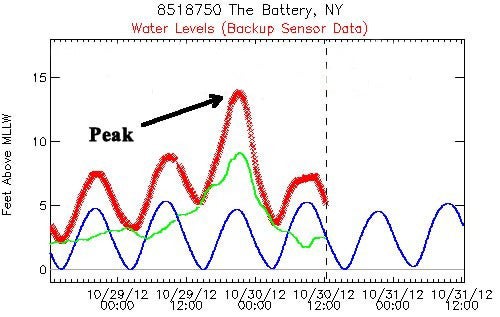 This graph shows tidal levels (blue) and actual water heights (red) during the approach and landfall of Sandy. The green line is the difference between the two. (Image courtesy NOAA.)
Tidal definitions can be astoundingly complex. I found myself flummoxed at more than one point during Sandy’s approach. Here’s a nutshell version of what a newbie might want to know:
The graphic at the top of this page shows high-water values relative to the fixed benchmark of MLLW during the most recent averaging interval, which is 1983–2001. Sea level rise has added roughly 18 inches to mean sea level at Battery Park since the 1850s, or about a foot since 1900. Although this is slowly pushing up the water levels during both low and high tides, the tidal range itself is controlled by astronomical factors. Because the graphic shows tidal levels against a fixed benchmark, we’ve chosen to depict sea level rise as a component of the storm surge (solid and crosshatched orange areas).
The crosshatched area shows how much of the highest water level in each storm can be attributed to sea level rise since 1900. For simplicity, we’ve assumed a purely linear trend. While the rise isn’t spectacular, it’s adding more to the total water levels of each storm with each passing year. And even a small bit of extra water can have a major effect once flooding is under way.
One variable not considered here is how landfill and other changes to the landscape in and near New York Harbor might have affected surge values over the years. There have been many such changes, including the creation of Battery Park City in the 1960s atop landfill just north of Battery Park. However, most of that reclaimed land displaced only shallow water.
“I don't know of any studies of how the [1960s] construction may have affected the tides at the Battery, but I doubt it would be big enough to have much of an effect,” says tidal expert Chris Zervas (NOAA National Ocean Service). “At some places, dredging deeper shipping channels can increase the tidal range, but we don't see that for more than a handful of our stations.” In any event, the wide reach of Sandy’s spectacular surge transcends such factors by a long shot.
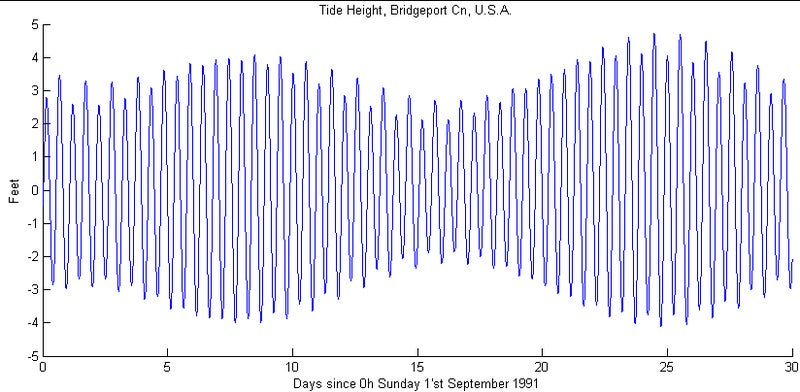 This depiction of one month of tides at Bridgeport, Connecticut shows the influence of the full moon (left peaks) and new moon (right peaks) in boosting tidal levels. (Image courtesy Wikipedia.)
What about the moon? Lunar effects were often cited during the runup to Sandy as a potential exacerbating effect. Indeed, there was a full moon on the day Sandy arrived, and tidal ranges are generally higher during a full moon. However, Sandy ended up striking in the evening, during the lower of the day's two high tides, which made a real difference.
“If the storm surge had combined with the morning tide, the water levels reached could have been about seven inches higher than those that occurred,” says Zervas. Had Sandy struck two weeks earlier or later, at the highest tides during the new moon, water levels could have been up to 17 inches higher than observed.