Spectacular sunspots
Beauty and insight emerge from the first comprehensive sunspot model
Sep 11, 2009 - by Staff
Temporary impacts to NSF NCAR Road, Parking Lot and Trails
View more information.Sep 11, 2009 - by Staff
1 September 2009 • In a breakthrough that will help scientists unlock mysteries of the Sun and its impacts on Earth, an international team of scientists from NCAR and the Max Planck Institute for Solar System Research (MPS) has created the first-ever comprehensive computer model of sunspots. The resulting visuals capture both scientific detail and remarkable beauty.
The high-resolution simulations of sunspot pairs open the way for researchers to learn more about these vast and mysterious dark patches on the Sun's surface. Ever since outward flows from the center of sunspots were discovered a century ago, scientists have worked toward explaining the complex structure of sunspots, whose numbers peak and wane during the 11-year solar cycle.
"Advances in supercomputing power are enabling us to close in on some of the most fundamental processes of the Sun," says Michael Knölker, director of NCAR's High Altitude Observatory (HAO) and a co-author of two recent papers on the NSF-funded modeling effort. "A comprehensive physical picture is emerging for everything that observers have associated with the appearance, formation, dynamics, and decay of sunspots."
The most striking visible manifestations of solar magnetism, sunspots are associated with massive ejections of charged plasma that can cause geomagnetic storms and disrupt communications and navigational systems. They also contribute to variations in overall solar output, which can affect weather on Earth and exert a subtle influence on climate patterns.
"This is the first time we have a model of an entire sunspot," says Matthias Rempel, an HAO scientist and lead author of papers this year in The Astrophysical Journal (20 January) and Science (10 July). "If you want to understand all the drivers of Earth's atmospheric system, you have to understand how sunspots emerge and evolve."
Simulating sunspots at the detail now achieved would have been impossible just a few years ago, before the emergence of new supercomputers and a growing array of instruments to observe the Sun. Partly because of such technology, scientists have made advances in solving the equations that describe the physics of solar processes. The research team, including MPS's Manfred Schüssler and Robert Cameron, improved a MPS computer model that built upon numerical codes created at the University of Chicago for magnetized fluids.
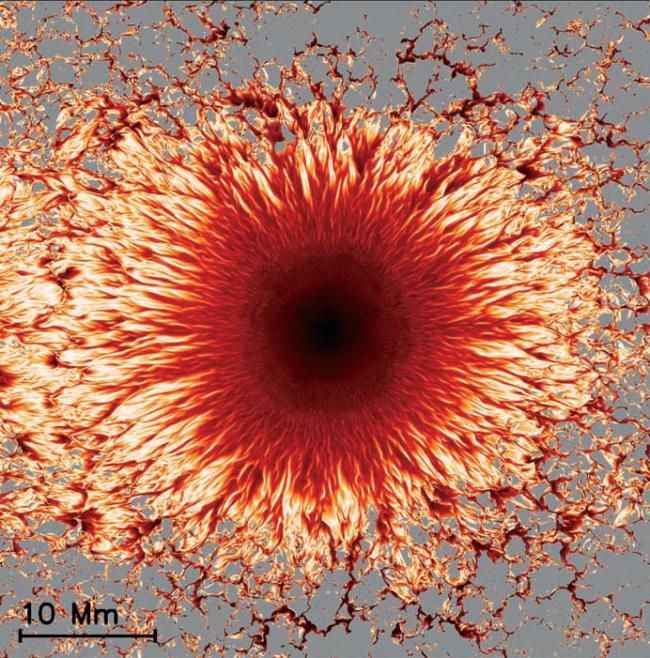 The interface between a sunspot’s umbra (dark center) and penumbra (lighter outer region) shows a complex structure with narrow, almost horizontal (lighter to white) filaments embedded in a background that has a more vertical (darker to black) magnetic field. Farther out, extended patches of horizontal field dominate. The scale at lower left shows 10 million meters. (Images courtesy Matthias Rempel.)
The model results capture pairs of sunspots with opposite polarity. In striking detail, they reveal the dark central region, or umbra, with brighter umbral dots, as well as webs of elongated narrow filaments with flows of mass streaming away from the spots in the outer penumbral regions. They also capture the convective flow and movement of energy that underlie the sunspots, motion that can't be directly detected by current instruments.
The model shows the close connection between magnetic field inclination and the structure of convective motions. The authors conclude that there is a unified physical explanation for the structure of sunspots in umbra and penumbra that is the consequence of convection in a magnetic field with varying properties.
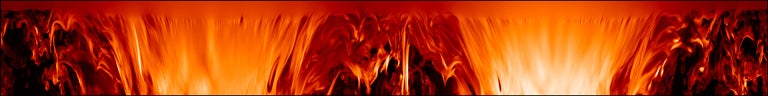 Lighter/brighter colors indicate stronger magnetic field strength in this subsurface cross section of two sunspots.
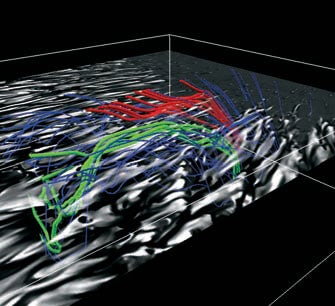 This 3-D schematic highlights some of the magnetic field lines in one sunspot’s penumbra. The red field lines show a typical filament in the inner penumbra, while green shows a typical filament in the outer penumbra. The anchoring points for the blue field lines were chosen randomly to give the visualization a background field not necessarily associated with the individual filaments shown. This visualization was created using NCAR’s VAPOR (Visualization and Analysis Platform for Ocean, Atmosphere, and Solar Researchers).
To create the model, the research team designed a 3-D domain that simulates an area on the Sun in unprecedented detail. The domain spans about 49,000 by 98,000 kilometers (31,000 by 62,000 miles) in width and about 6,100 km (3,700 mi) in depth—an expanse as long as eight times Earth's diameter and as deep as Earth's radius. The model simulates sunspot dynamics at 1.8 billion points within the virtual expanse, each spaced about 15-30 km (10-20 mi) apart. The work drew on increasingly detailed observations from a network of ground- and space-based instruments to verify that the model captured sunspots realistically.
Simulating the two-hour evolution of a pair of sunspots took weeks on NCAR's bluefire supercomputer, which can perform 76 trillion calculations per second. Though far more detailed and realistic than previous simulations, even the new model's output does not accurately capture the lengths of the filaments in parts of the penumbra. In future work, the researchers hope to extend the modeled time period to around eight hours. They also plan to explore adaptive or nested grids that could examine fine details of penumbrae while keeping the demands on computing time reasonable.
If funding permits, the next great leap for Rempel and colleagues over the next several years would be to simulate several days of an active region, which is a large expanse of enhanced solar activity that can encompass a number of sunspots and other features. Such modeling could require a domain of eight billion grid points—several times wider and deeper than the current model—and computing resources in excess of 10 million CPU hours on a computer such as bluefire.
"We can make significant new discoveries by expanding on this experiment in time span, domain, and grid resolution," says Rempel. "Improved resolution will allow us to better model turbulent features. We will also be able to make detailed comparisons with high-resolution observations coming in the near future from large-aperture solar telescopes."