
UCAR/NCAR calculates its greenhouse gas emissions
Oct 1, 2009 - by Staff
Oct 1, 2009 - by Staff
October 1, 2009 | In late September, Sustainable UCAR announced preliminary results from
the first-ever inventory of UCAR/NCAR's annual greenhouse gas emissions,
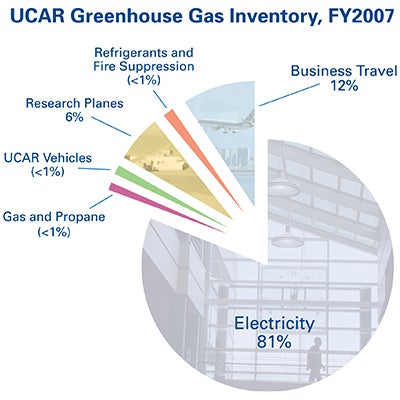
showing that electricity use is by far the organization's largest source of
emissions (about 81%), with business travel in second place at about 12%.
UCAR/NCAR made a commitment to examine its greenhouse gas
emissions and impacts on climate change when joining the Environmental Protection
Agency's Climate Leaders Program in 2008. Following EPA protocols, Sustainable
UCAR calculated emissions from building operations, vehicle fleet, and business
travel, using fiscal year 2007 as a baseline. The inventory includes facilities
and property for which UCAR has operational control, covering Foothills Lab,
Center Green, the Mesa Lab, Research Aviation Facility, Marshall Field Site,
Mauna Loa Observatory, and leased office space in Washington, D.C.
It is typical for the lion's share of emissions at
office-based businesses and research institutions to come from electricity
usage, according to Sustainable UCAR's Kimberly Kosmenko. The inventory found
that the majority of UCAR's electricity usage (61%) goes into cooling and
heating buildings, lighting, and machinery and appliances. The remaining 39%
goes into powering and controlling temperature in the ML supercomputing center.
Adding up air miles
Other sources of UCAR/NCAR's emissions include business
travel (12%), research aircraft (6%), owned and leased vehicles (<1%), gas
and propane (<1%), and refrigerant leakage and fire suppression emissions
(<1%).
Business air travel paid for
by UCAR/NCAR amounts to more than 20 million miles annually, according to the
inventory. Doug Nychka (IMAGe) helped Sustainable UCAR develop a
methodology for calculating these miles, advised the data collection process,
and conducted statistical analysis.
In order to determine the number and distance of UCAR-paid
flights taken by travelers in fiscal year 2007, Doug and the team selected a
random sample of travel authorizations and then extrapolated the total distance
of flight segments in the short-haul, medium-haul, and long-haul categories in
order to accurately calculate the total emissions. (Because additional fuel is
burned in takeoff and landing, the average emissions per mile are greater for
short-haul flights. Long-haul flights have the highest efficiency on a per-mile
basis.)
What now?
Now that UCAR/NCAR has a baseline greenhouse gas inventory,
the organization's next step is to consider emissions management goals. "At
this time, our primary focus is on identifying opportunities to reduce our
electricity usage," Kimberly says. "Because electricity usage leads to the
majority of our emissions, it's the natural place to begin mitigation efforts."
The organization is considering three possibilities for
reducing electricity use: producing renewable energy onsite, modifying
purchasing and usage of electronics and appliances to reduce energy demand, and
improving the overall energy efficiency of building systems.
Sustainable UCAR plans to compile and release inventories
for fiscal years 2006, 2008, and 2009 by the end of 2010 in order to reveal
trends over time. Greenhouse gas inventories will be completed annually in the
future. The program will keep staff updated as plans develop.
Staff interested in making greener purchasing choices and
reducing resource use at the office can find tips on Sustainable UCAR.