New views of Sandy
High-resolution models shed light on 2012 disaster
Oct 1, 2013 - by Staff
Temporary impacts to NSF NCAR Road, Parking Lot and Trails
View more information.Oct 1, 2013 - by Staff
Bob Henson • October 1, 2013 | It’s been almost a year since the storm named Sandy pummeled the northeast United States. But the fearsome cyclone lives on within the circuits of supercomputers that are replicating its unusual evolution and track.
As the hurricane threatened the Eastern Seaboard last autumn, NCAR scientists watched it unfold through high-resolution forecasts issued every six hours by Advanced Hurricane WRF. (AHW is the NCAR-based, hurricane-oriented, advanced version of the multiagency Weather Research and Forecasting model, or WRF.)

Sandy’s unique track culminated in a bend to the west-northwest that brought the storm into the New Jersey coast. Brighter colors indicate higher surface winds; click on map to see original version with legend. (Image courtesy Wikimedia Commons.)
Like many of its peers, AHW initially predicted an offshore track for Sandy. But several days before landfall, the model shifted to a more accurate forecast of Sandy’s nearly-unprecedented sharp left hook into New Jersey.
Dramatic AHW animations of Sandy were prominently featured at a town hall in January at the annual meeting of the American Meteorological Society. Since then, several NCAR scientists have dug more deeply into the storm’s behavior for a paper now online at Monthly Weather Review. Meanwhile, the AHW forecasts have been replicated in new and stunning detail, resulting in one of the finest-scale animations to date of any hurricane.
Both projects were discussed in August at the AMS Conference on Mesoscale Meteorology. (See the first two recorded presentations in the meeting program.)
One of the many intriguing aspects of Sandy was its multiple phases. After striking Cuba as a Category 3 hurricane, the storm dipped below hurricane strength, but then it slowly gained power and size as it moved northeast, paralleling the Gulf Stream. Typically, such a system would continue moving toward the northeast and east, away from North America. But a huge mass of high pressure centered in Greenland partially blocked that path. At the same time, the polar jet stream was dipping sharply into the eastern United States.
These two features steered Sandy on a path that swung to the west-northwest into southern New Jersey (see map at left). As the storm made its leftward bend, it reintensified to Category 2 status and then began transforming into a post-tropical cyclone. This prompted the National Hurricane Center to reclassify Sandy as post-tropical at 7:00 p.m. EDT on October 29, only an hour before landfall.
Since the January AMS meeting, Tom Galarneau, along with NCAR colleagues Chris Davis and Mel Shapiro, have analyzed additional AHW simulations, which they describe in the just-released paper. They explain that Sandy’s life cycle—unique in Atlantic hurricane annals—was actually a blend of several well-studied phenomena that hadn’t been previously shown to come together in such a way near a major coastline.
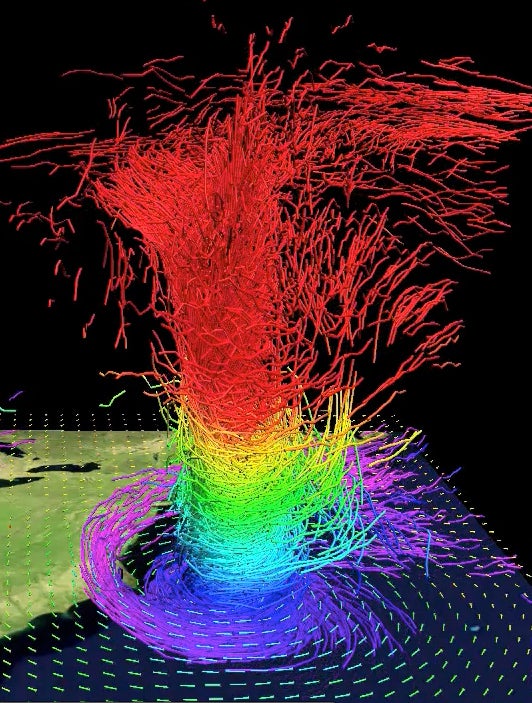
In this 3-D map of potential temperature, relatively cool air wraps around Sandy's core near the surface (purple and blue colors), while air parcels gain heat from moisture condensing into clouds and precipitation as they ascend through the storm’s core. For more details on this simulation, see the YouTube videos below. (©UCAR. Image courtesy Mel Shapiro, NCAR. This image is freely available for media & nonprofit use.)
Strong winter storms at sea sometimes develop pockets of warm air within their cold cores—a process known as warm seclusion, first characterized by Shapiro and Daniel Keyser. However, in this case, the warm air being secluded was already present in Sandy’s inner core. This is the first time such a dramatic warm seclusion has been documented in a landfalling U.S. hurricane. Galarneau and colleagues did find examples documented in the scientific literature that occurred elsewhere, including hurricanes Iris (1995) and Lili (1996)—both far out in the North Atlantic—as well as eight North Pacific typhoons in 2001 and 2002 documented in a paper by Naoko Kitabatake (Japan Meteorological Agency). However, none of these other examples exhibited a dramatic northwest turn similar to Sandy's.

Tom Galarneau (©UCAR. Photo by Carlye Calvin. This image is freely available for media & nonprofit use.)
Although the NHC reclassification of Sandy just before landfall was a controversial move in some quarters, Galarneau thinks it was justified from a scientific point of view: the AHW runs show that the mechanisms driving Sandy’s reintensification were nontropical, and the storm’s warm core was completely secluded by cold continental air at that point. Starting this year, NHC will allow hurricane warnings to be retained even if a storm is reclassified as post-tropical before striking land (see PDF).
Galarneau is now investigating Sandy’s track more closely. It’s the strongest storm known to strike as far north as New Jersey at a west-northwest angle in U.S. records going back to the 1850s. Galarneau has found several other tropical systems off the mid-Atlantic that moved toward the north or northwest during the September-through-November period. However, of the 18 systems identified, only five interacted with a dipping jet stream over the eastern United States and a blocking high near Greenland, a la Sandy. Each of these five occurred much earlier than Sandy in the hurricane season and interacted with much weaker dipping jet streams.
"Comparing Sandy to these other tropical systems underscores the unusual nature of Sandy,” says Galarneau.
For now, Galarneau is agnostic on the controversial theory that sea ice loss in the Arctic may have increased the likelihood of blocking highs such as the one that helped steer Sandy northwestward. He and colleagues agree there’s much more science yet to be done on the dynamics of this most unusual storm.

Mel Shapiro (©UCAR. Photo by Bob Henson. This image is freely available for media & nonprofit use.)
NCAR’s Shapiro has led the charge in another research direction: simulating Sandy at ultra-fine-scale resolution. This project emerged after Peter Johnsen (Cray Inc.) saw Shapiro’s AMS presentation in January and suggested a deeper dive. The two joined forces with Mark Straka at the National Center for Supercomputing Applications (NCSA), an NSF-funded facility located at the University of Illinois at Urbana-Champaign. Their work was also supported by the U.S. Office of Naval Research.
Over the last several months, this team has used the Advanced Research WRF (ARW) model to replicate Sandy and its environment in unprecedented detail. In these model runs, each horizontal grid point is separated by just 500 meters (about 1600 feet). Since the model includes 150 vertical layers, this means that weather conditions were calculated at more than four billion points for each second in a 96-hour simulation.
![]()
Simulation 1: Cloud Tops (All videos @UCAR. All are courtesy Mel Shapiro, NCAR, et al. and are freely available for media & nonprofit use.)
![]()
Simulation 2: Radar Reflectivity
![]()
Simulation 3: Potential Temperature
![]()
Simulation 4: Wind Speeds
![]()
Simulation 5: Trajectories of Air Parcels
Carrying out this Herculean task required 58 hours of time using 140,000 cores (CPUs) on Blue Waters, a Cray XE6 supercomputer at NCSA. The raw data—49 terabytes’ worth—were processed by Alan Norton and Perry Domingo at NCAR’s Computational and Information Systems Laboratory, using the lab’s VAPOR software (Visualization and Analysis Platform for Ocean, Atmosphere, and Solar Researchers).
At left are links to five of the animations produced thus far, which are available on the AtmosNews YouTube channel. They’re aesthetically as well as scientifically gripping—a point not lost on Shapiro, an art and design aficionado.
Shapiro and colleagues are just beginning to analyze the features brought to vivid life by the animations. These include the wrapping of cold air around Sandy’s warm core, the evolution of showers and thunderstorms that helped fuel Sandy, and bands of heavy snow that fell over the Appalachians.
At the National Hurricane Center (NHC), forecasters don’t have the luxury of such detailed model results when a hurricane approaches, since the computational demands are so enormous. But the team behind the ultra-fine AHW simulations is pursuing a possible demonstration project that would see if such projections are actually feasible in real time and whether they could bring value to the warning process. This could occur through the ten-year, NOAA-based Hurricane Forecast Improvement Project (HFIP), which is evaluating a variety of modeling approaches.
Right now, the NOAA’s Hurricane WRF model (HWRF) is being run in real time through HFIP at a more modest resolution—27 km—in an experimental basin-scale domain covering the entire region from Hawaii to West Africa, between 10°S and 60°N. This is a broadened, next-generation version of the current operational version of HWRF, a collaborative effort involving NOAA’s Hurricane Research Division and Environmental Modeling Center. Both versions of the model allow individual storms to be tracked through moving nests, each with a resolution as fine as 3 km.
“What we’ve proposed is to run the entire basin-scale domain at a uniform 3-km resolution, to learn what we are losing by the nesting and to demonstrate the benefit of uniform grids,” says NOAA’s Frank Marks. Cray has the latest version of the operational HWRF installed, says Marks, “so the next step is to see whether the proposed configuration is reasonable to run in near real time.”
There’s also been preliminary discussion among NCAR, Cray, and NOAA of possibly bringing 500-meter resolution into HWRF for testing. HFIP runs through 2019, with forecast demonstration experiments planned each year until then.
Storm surge—which kills most Americans who die in hurricanes—is a priority in HFIP. Starting this year, the project is experimenting with an operational storm-surge model tied to the operational version of HWRF, a collaboration involving several parts of NOAA and its National Weather Service. As with all HFIP demonstration model runs, these storm surge forecasts will be made available to hurricane forecasters at NHC for use and evaluation, though not released directly to the public (to avoid confusion with official hurricane and storm surge forecasts).
Meanwhile, the team behind the 500-meter ARW runs is looking into linking their ultra-fine-scale modeling with a storm surge model such as ADCIRC (based at the University of North Carolina), which is now being adapted by NCAR’s Carl Drews for higher-resolution use. Such a pairing might eventually allow river channels, seawalls, and other fine-scale local features to be incorporated into storm surge forecasts.
Though not involved in the ultra-fine-scale modeling efforts himself, NCAR's Tom Galarneau is watching with interest. “Sandy would be a good example to use in testing the value of ultra-high resolution, because of the wide range of coastline shape and infrastructure that it affected,” he says.
Enhancing the resolution of a model doesn’t necessarily improve its accuracy, of course, so more work is needed to comprehensively determine how well the 500-meter resolution performs. Thus far, Shapiro and colleagues are encouraged by how well the results match up with satellite imagery (see graphic below). As such simulations become more common, Shapiro thinks they could open major new avenues for research and prediction. As he noted in his AMS conference talk in August, “You will discover things about our atmosphere that you never even dreamt existed.”
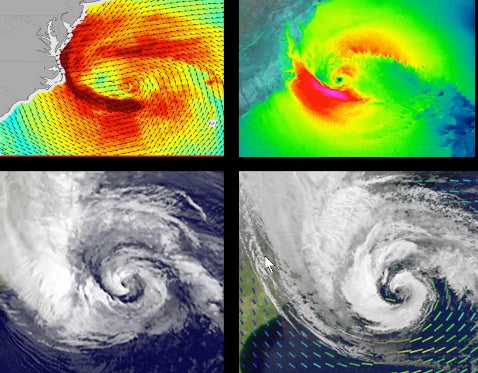
Ultra-fine-scale simulations of Sandy’s near-surface winds (upper right) and cloud-top temperatures (lower right) closely resemble the observations derived from satellite data (at left). (©UCAR. Images courtesy Mel Shapiro, NCAR. This image is freely available for media & nonprofit use.)