California dryin’
The outlook for rainfall, water supply, and energy
Jan 13, 2014 - by Staff
Jan 13, 2014 - by Staff
Bob Henson • January 13, 2014 | The first precipitation measurements in what’s now downtown San Francisco began in July 1849, a year before statehood. Now extending almost 165 years, the local rainfall database is one of the nation’s longest—and never has it shown a year as dry as 2013.
From the Mexican border to the Pacific Northwest, the past 12 months have left records lying in the dust. It’s been the most parched calendar year in the weather annals of two state capitals (Salem, OR, and Sacramento, CA) as well as Los Angeles and other locations in between. The table below shows how far the new records dipped not only below average but below the prior records.
City New record Old record Average Records begin
  Los Angeles, CA     3.60”       4.08” (1953)     14.93”     1877
  San Francisco, CA   5.59”       9.00” (1917)     23.65”     1849
  Shasta Dam, CA     16.61”      27.99” (1976)     62.72”     1943
  Eugene, OR         21.19”      23.56” (1944)     46.10”     1890
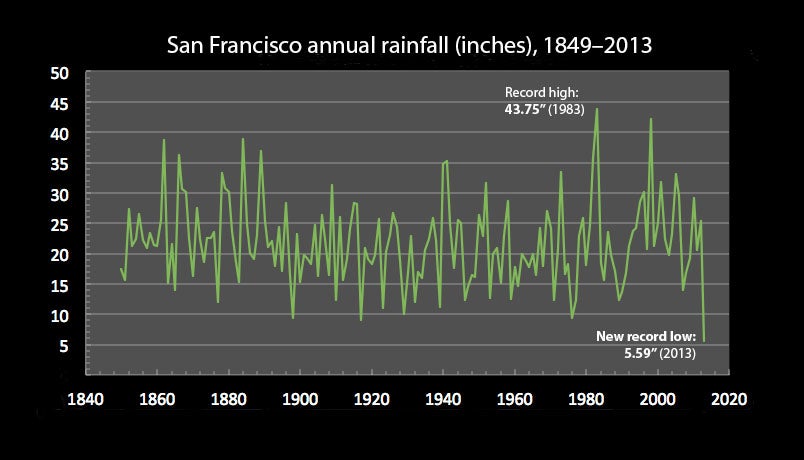
San Francisco’s rainfall is prone to sharp swings from one calendar year to the next, but the dry conditions of 2013 are well below anything experienced since precipitation records began there in 1849. The recording site has moved several times within the downtown area during this period (see history). Golden Gate Weather Services maintains a comprehensive website with various San Francisco rainfall statistics. (Graphic ©UCAR, data courtesy Jan Null. This image is freely available for media & nonprofit use.)
Given this magnitude, it’s impressive how little everyday life in California has been affected by the growing drought. Despite pleas from lawmakers, the state has yet to declare a drought emergency, and Angelenos aren’t yet being asked to take any special measures. That’s largely due to the peculiarities of water supply and delivery across the Southwest. It’s a complex system involving both water and energy, and NCAR scientists are working to unravel how its future may evolve in a climate where rainfall trends are uncertain. Update – January 17: California governor Jerry Brown officially declared a drought emergency today.
As impressive as the 2013 rainfall records are, those who watch California weather will be even more focused on what happens over the next several months. Most of the state’s rainfall comes in the winter—roughly a third of the water used in California is drawn from the Sierra Nevada’s vast snowpack—so it’s the fall-through-spring totals that make or break things in the dry heat of summer. That’s why experts look to the water year (July–June), rather than the calendar year, as the crucial index of California precipitation.
That said, the 2013–14 water year is off to a rotten start. It’s telling that a 900-acre fire destroyed dozens of homes in the Big Sur area only a few days before Christmas. The Sierra’s snowpack water content was 84 percent below average as of January 10. This week appears likely to bring record warmth to much of California, along with strong, dry winds and high fire danger in some areas.
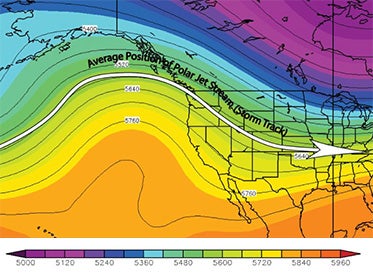
Rather than bringing wet storms from the Pacific into California, the jet stream at the 500-millibar level (about 18,000 feet) arced far to the north during most of December 2013, as shown in this map of conditions averaged for the month. (Original graphic by NOAA/ESRL Physical Sciences Division, courtesy John Monteverdi, San Francisco State University.)
The culprit: a powerful, persistent ridge of upper-level high pressure has prevailed off the U.S. West Coast for more than a year now. This pattern—the strongest and longest-lasting of its type in decades, according to meteorologist/blogger Daniel Swain—tends to steer wet, mild Pacific storms far to the north. Fairbanks, Alaska, got its third freezing rain event of the autumn in early December, a time when the average low temperature there is around –12°F.
East of this high pressure zone, which Swain has dubbed "The Ridiculously Resilient Ridge," the jet stream has dipped well south into the central and eastern U.S., bringing some of the most intense winter chill that's been observed in recent years (including the subzero air mass that invaded the region last week).
Right now, both the short-range and seasonal outlooks remain worrisome. The most recent model guidance from the National Weather Service's Global Forecast System (GFS), which looks ahead 16 days, suggests little if any rain for much of California into the last week of January. And the latest seasonal outlook from NOAA indicates that the drought is likely to persist throughout most of the Southwest through March.
As Swain puts it, "each day that passes without meaningful precipitation is another day when our long-term deficits grow measurably larger."
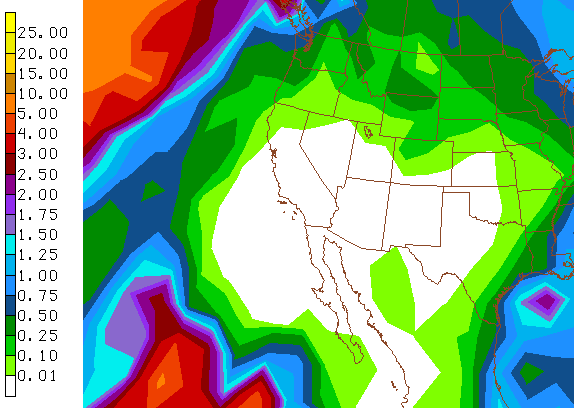
A rainless ridge dominates the southwest United States, including California, in the 384-hour forecast produced by the NWS Global Forecast System at 06Z (1:00 a.m. EST) on January 13. The graphic above shows cumulative precipitation in inches predicted by the model for the entire 16-day period ending on January 29. (Image courtesy NOAA/NWS National Centers for Environmental Prediction.)
Still, things can change quickly this time of year, notes Jan Null (Golden Gate Weather Services). Now a consulting meteorologist, Null is a former lead forecaster at the Bay Area’s National Weather Service office. He’s followed regional rainfall for a long time, having completed his master’s thesis at San José State University on San Francisco’s precipitation climatology.
Null points out that, as opposed to the frequent but lighter rains of a Seattle winter, California tends to gain most of its precipitation in a few big events, which often occur from midwinter to early spring.
“We still have almost six months to go,” says Null. “There are terms in the water community such as Fabulous February, Miracle March, and Awesome April. All of these have been used when we’ve turned things around after the first half of the water year.”
Focusing too much on the calendar year data, Null adds, “is like taking the last half of one 49ers game, combining it with the first half of the next game, and saying, ‘We won!’ ”
Water and energy are intertwined in many ways across the U.S. Southwest, including California. Some of those connections stand out more clearly in the harsh light of a drought. Yet there’s been little quantitative study of the interplay between the two variables as climate change unfolds.
Using the Southwest as a first case study, NCAR’s David Yates and colleagues have developed a modeling system that takes on this challenge. It tracks how energy and water resources interact as population and water demands grow and as climate swings in and out of periods of drought.
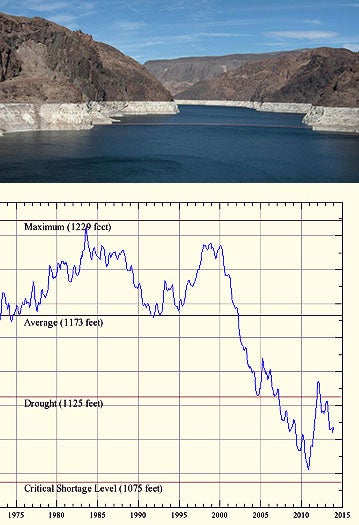
The "bathtub ring" around Lake Mead (top, photographed in 2007), an important water source for California, reveals the effect of low levels since the early 2000s. After reaching a record low in 2010–11, the reservoir made a brief recovery before dipping back down over the last two years. As of January 13, the reservoir's water level was at 48% of capacity ("full pool"). (Wikimedia Commons photo by Waycool27; chart courtesy Lake Mead Water Database.)
Yates and NCAR colleague Kathleen Miller recently published a summary of the project, which is supported by the NOAA Sectoral Applications Research Program. It incorporates two models, both developed for resource managers by the Stockholm Environment Institute in collaboration with NCAR:
There’s no shortage of complexity when trying to accurately represent and predict the flows and interrelationships of water and energy across the Southwest. California's vast cities and farms draw most of their water from the yearly Sierra snowpack and the Colorado River system, including Lake Mead (pictured at right).
It takes a lot of energy to move water hundreds of miles from those locations to where it’s needed. In fact, an estimated 19% of California’s electricity use and 32% of its natural gas consumption are related to water use. And there are complex regulations dictating who gets first rights to each drop.
Yates and colleagues are now analyzing results from a WEAP-LEAP integration that examines how a ten-year-long drought—similar to the driest decade in a paleoclimatic simulation of the period 1456 to 1500—might affect the California of the 2020s. Among other things, a drop in available hydropower could force the state to consume more fossil fuel, which could butt up against increasingly strict guidelines for greenhouse gas emissions.
Reduced hydropower would also cut into the very energy that’s used to pump water from distant reservoirs to farms and cities.
Desalination is drawing interest as a way to wring potable water from the oceans that lie next door to California’s biggest cities. However, it also requires major power. A WEAP-LEAP analysis of this topic assumes that about 5% of Southern California’s water could be produced by desalination by the year 2049. In that scenario, greenhouse gas emissions are slightly higher than for “business as usual,” and the region would still need to import large amounts of water due to growing demands on top of increased year-to-year variability.
Climate models for the 21st century continue to disagree on whether total precipitation will increase or decrease this century across the Southwest, as noted in a 2013 regional report serving as input for this year’s pending U.S. National Climate Assessment. The risk of long-term precipitation decline appears greater the further south you go in the region, and short-term variability is expected to remain larger than any longer-term shift.
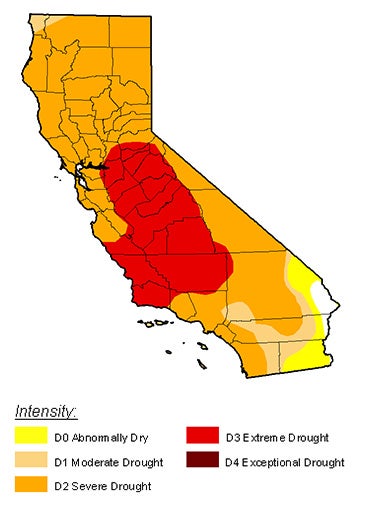
In the most recent weekly U.S. Drought Monitor, based on data through January 7, 2013, about 28% of California is categorized as being in "extreme drought," and more than 98% of the state is experiencing some level of drought. (Analysis by Matthew Rosencrans, NOAA Climate Prediction Center.)
There’s higher confidence that rising temperatures will tend to pull more moisture out of the system when drought happens to strike. Warmer conditions will tend to reduce the average snowpack and advance the timing of spring melt across the Sierras. Similar effects are expected in the snowy, high-altitude origins of the Colorado River. The NCAR-led Colorado Headwaters project has been working to simulate how water supplies downstream might change as the century unfolds.
As for the current drought, Yates is watching it closely. After two consecutive water years on the dry side, a severe drought this year could bring increasing trouble. Los Angeles is high on the hydrological pecking order, so the city is projecting ample water supply into at least 2015, but some Central Valley farmers may have to let fields go fallow this summer. Many other complications could ensue if the drought extends into midyear, including an increased risk of major wildland fires.
Groundwater often serves as a backup during California drought, but increased pumping is making that resource more scarce over time—and the pumping itself uses energy.
“It’ll be interesting to see how agricultural irrigators turn to groundwater and what kind of impact that has on electricity use in California,” says Yates. “If there’s a hot summer,
I wouldn’t be surprised to see strains on the electrical system.”