Inside the warming hiatus
A 15-year pause for some regions and seasons, but not in the ocean
Jan 8, 2014 - by Staff
Jan 8, 2014 - by Staff
Bob Henson • January 8, 2014 | The globally averaged surface air temperature hasn’t risen much in the last 15 years. But as a fresh batch of research has made clear, there’s been ample heating of Earth—which becomes evident when looking at certain times of the year and in particular locations, including deep in the ocean.
One of the latest examinations of this topic comes from NCAR scientists Kevin Trenberth and John Fasullo in Earth’s Future, the new open-access journal from the American Geophysical Union. The title of their December 5 paper—“An apparent hiatus in global warming?”—hints at the frustration many scientists (as well as some policy makers) have felt over how the global pause in surface temperature has sometimes been interpreted.
As Trenberth and Fasullo put it, “Global warming has not stopped; it is merely being manifested in different ways.”
Regional and seasonal variations help drive home this point.
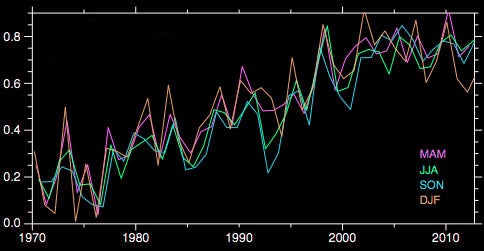
This graphic shows globally averaged temperature anomalies (deviations from a 30-year average) in degrees Celsius since 1970 as compiled by NOAA. Most of the hiatus in atmospheric warming since the early 2000s has occurred during the months December through February (DJF, the orange trace above). (Graph adapted from Figure 3, "An apparent hiatus in global warming?", Earth's Future, doi:10.1002/2013EF000165.)
These two factors imply that what’s been seen as a global pause in warming isn’t really a worldwide phenomenon.
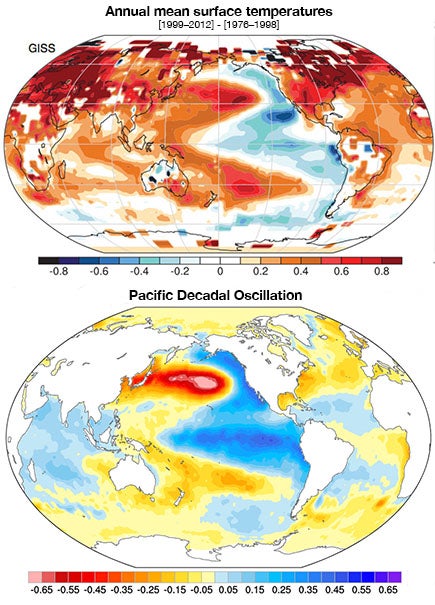
The Pacific Decadal Oscillation leaves a footprint of anomalies in sea surface temperature (lower map) that closely matches the pattern of recent global temperature trends (top map, derived from NASA/GISS data for the period 1999–2012 as compared to 1976–1998). (Images adapted from Figures 8 and 9, "An apparent hiatus in global warming?", Earth's Future, doi:10.1002/2013EF000165.)
The top map at left brings out the spatial variation even more clearly. It compares air temperatures during the hiatus period (1999 up to 2012) with those in the preceding 23 years (1976–1998), when relatively rapid warming was under way.
What jumps out right away is the band of blue, indicating cooling, that hugs the entire west coast of the Americas, from Alaska to Chile, with a large spike extending west into the central tropical Pacific.
“It is the central and eastern Pacific, more than anywhere else, that has not warmed in the past decade or so,” notes Trenberth.
As it turns out, the pattern of observations shown in this map closely resembles the signature of the Pacific Decadal Oscillation (PDO), as shown in the bottom map at left.
Like an oceanic cousin of the El Niño/Southern Oscillation (ENSO), the PDO switches back and forth between warm (positive) and cool (negative) modes. However, it changes modes only about every 20 to 30 years, rather than every year or two like ENSO. When the PDO is positive, El Niños tend to be stronger and more frequent; when it’s negative, La Niñas typically predominate.
That’s a critical point, because it’s well known that El Niño events serve as a giant release valve for ocean heat. During El Niño, shifts in ocean circulation allow the surface waters of the eastern tropical Pacific to warm dramatically. That can pump enough heat into the global atmosphere to boost temperatures by up to 0.4°C (0.7°F) for the better part of a year. Likewise, during a strong La Niña, oceans as a whole retain more heat than usual, and the global atmosphere cools down for a few months.
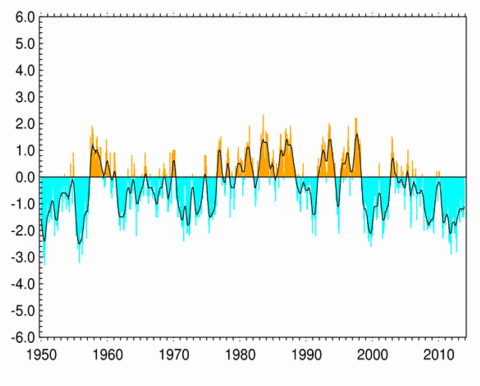
The Pacific Decadal Oscillation, or PDO, tends to alternate between positive (warm) and negative (cool) phases every 20 to 30 years, with cool conditions predominating in the last 15 years. (Graph courtesy NOAA National Climatic Data Center.)
The blockbuster 1997–98 El Niño helped produce the record-warm year of 1998. Only a year later, the PDO entered a negative (cool) phase that’s persisted ever since, with no major El Niños but several significant La Niñas. It’s thus understandable that we haven’t seen a dramatic new record in global surface air temperature, even though both 2005 and 2010 nudged just past 1998 in NOAA’s long-term data.
The PDO is believed to be driven mainly by natural variations, and it’s not yet known what causes it to switch phases. Trenberth and Fasullo speculate that the record-strong El Niño of 1997–98 released so much heat from the ocean that the PDO’s switch to a heat-storing negative mode may have been some type of compensating response. If so, the mechanism behind it isn’t yet clear, and it’s quite possible that computer models of Earth’s climate aren’t capturing it.
According to Trenberth, the negative PDO might itself be setting the stage for a major compensation. The trade winds are a key player here, as changes in atmospheric pressure create the "sloshing water in a bathtub" effect that is a hallmark of both ENSO and the PDO. In the tropical Pacific, the tendency toward stronger-than-normal trade winds since the PDO’s last shift has pushed increasing volumes of water from east to west. Sea levels in and near the Philippines have risen by more than eight inches relative to the eastern tropical Pacific, which only added to the storm surge inflicted by Supertyphoon Haiyan in November 2013.
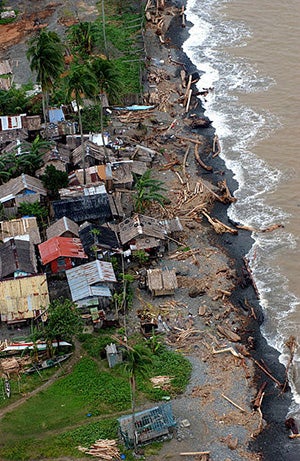
Not just Supertyphoon Haiyan: The Philippine coastline near Real, east of Manila, suffered major damage following several tropical cyclones in late 2004. Sea levels are rising more quickly in the western tropical Pacific than in many other parts of the globe, in part because of a persistent negative phase of the Pacific Decadal Oscillation. (Wikimedia Commons photo by Lance Corporal Joel Abshier, U.S. Marine Corps.)
“Eventually this difference in sea level becomes unsustainable, and the water sloshes back,” asserts Trenberth. “At some point, perhaps because of a fairly random weather event, we will likely have an El Niño event that leads us back into a positive PDO.”
Perhaps the most intriguing place where the hiatus isn’t a uniform entity is beneath the surface of the sea. The amount of ocean heat stored at deeper levels (below 700 meters, or 2300 feet) has increased markedly during the atmospheric hiatus.
Trenberth and Fasullo examined changes in ocean heat content using a newly released reanalysis called ORAS-4, produced by the European Centre for Medium-Range Weather Forecasts. Working with the ECMWF’s Magdalena Balmaseda, who led an in-depth analysis, they found that almost all of the net heat storage from 1980 to the early 2000s was in the upper 700 meters. Things changed after that, as the deeper oceans began absorbing heat at an ever-increasing rate. By 2010, more than a third of the added ocean heat from the previous decade had been tucked away below 700 meters.
It’s not obvious why the heat storage has evolved this way, but a major analysis published in July by the UK Met Office supports the general picture. In section 2 (see PDF), the report finds that the upper ocean has been out of radiative balance (a function of heat exchange) with the atmosphere since 2000, implying that heat is being stored in the deep ocean. The report also found that the post-2000 pattern in vertical heat exchange resembles what was observed from 1950 to 1965—a period that also featured a negative PDO and a flat trend in global temperatures.
Some scientists have found possible explanations beyond the oceans. In the current draft of its 2014 assessment, Working Group I of the Intergovernmental Panel on Climate Change addresses the gamut of possible causes (see PDF of Chapter 9, pp. 26–30).
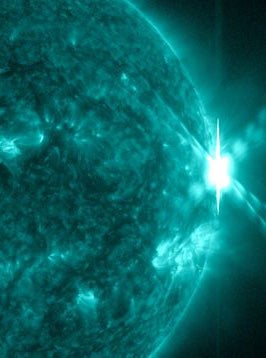
NASA's Solar Dynamics Observatory recorded this X2-class solar flare on September 29, 2013. The current peak in the 11-year cycle of solar activity follows one of the longest and most dramatic downturns in the cycle observed in the past century. (Image courtesy NASA.)
The IPCC attributes the hiatus in roughly equal measure to
The latter are mainly due to a series of weak volcanic eruptions and a prolonged downturn in the natural 11-year cycle that controls sunspots and other facets of solar activity. However, the IPCC expressed low confidence in its ability to determine quantitatively how much each of these factors contributed to the hiatus, and some of the most recent modeling studies suggest that an atmospheric heating pause can emerge through natural variability alone.
In calculations for a forthcoming paper, Trenberth and colleagues estimate that radiative changes might account for about 20% of the current hiatus, leaving ocean storage as the biggest player by far.
Climate contrarians have long observed that computer models of 21st-century climate didn’t “predict” the hiatus. However, these analyses overlook the fact that century-long trends are known to be masked by natural variability on decadal and shorter timescales. Moreover, global temperatures over the last 20 years are still within the range of model projections for an atmosphere that’s warming over the long term. (See "Modeling the pause," below, for several success stories.)
Looking ahead, long-range computer models from NOAA and other centers are already hinting that an El Niño event may be on the horizon in the latter part of 2014. If this happens, we might see a new global temperature record in 2014—which, in turn, might help put the much-belabored hiatus to rest.
Some climate models that link ocean and atmosphere have been able to simulate pauses in atmospheric warming lasting a decade or more. In these cases, an uptick in deep-ocean heat storage appears to account for the “missing heat”, as found by NCAR’s Gerald Meehl and colleagues in a 2011 study.
Researchers have also been able to replicate the current hiatus, and show its intimate link to the oceans, by putting sea-surface temperatures (SSTs) from the 1990s and 2000s into a model and letting the atmosphere run free. A group led by Virginia Guemas (Catalan Institute of Climate Science, Spain) found that models keying off global SSTs from the year 2000 suggested that surface warming would be tamped down over the next five years (which, in fact, it was).
Even if a model is given the observed SSTs only for the eastern tropical Pacific—less than 10% of the globe’s surface area—it can still do a surprisingly good job of simulating the ups and downs of global temperature over the last 50 years. That was the finding of Yu Kosaka and Shang-Ping Xie (Scripps Institution of Oceanography) in a paper published this past fall in Nature.