Cold but brief
Early January's Arctic chill came and went more quickly than past blasts
Jan 14, 2014 - by Staff
Temporary impacts to NSF NCAR Road, Parking Lot and Trails
View more information.Jan 14, 2014 - by Staff
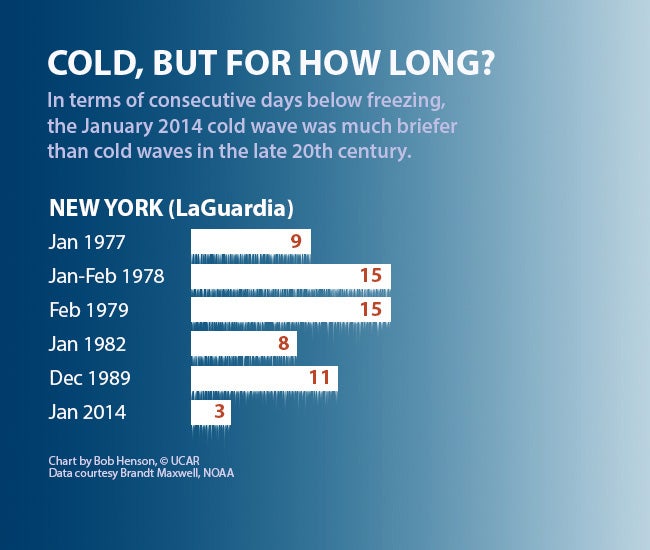
Bob Henson • January 14, 2014 | Last week’s Arctic outbreak brought some of the coldest air in decades across the Midwest and South. But interestingly, it didn’t last long.
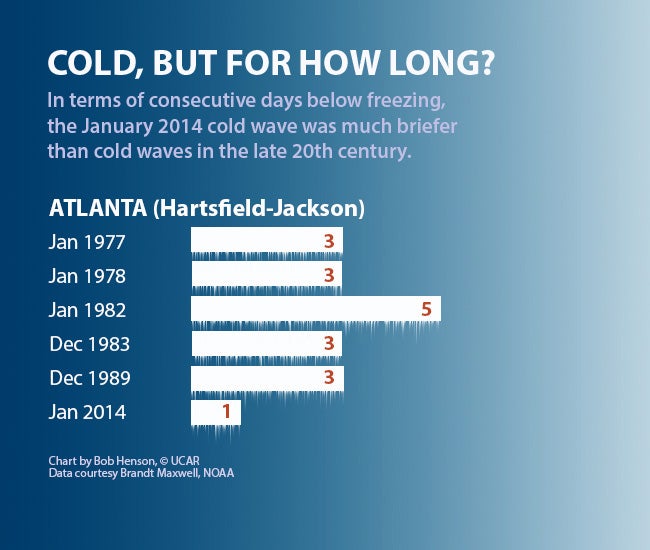
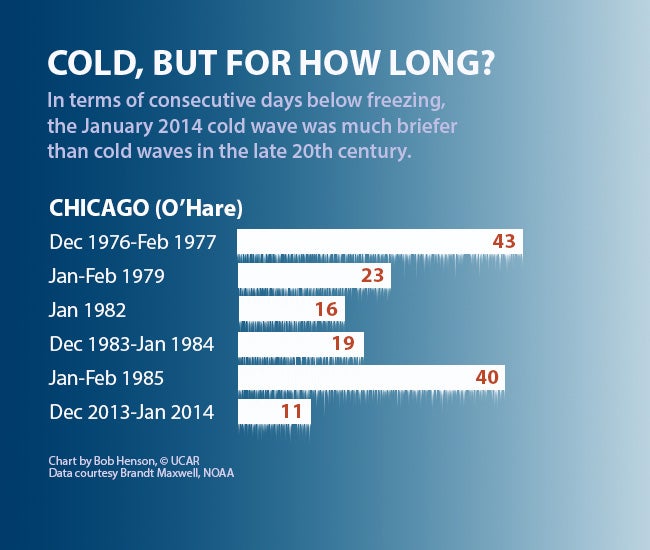
The graphics below show the number of consecutive days during this month’s cold snap that temperatures stayed below freezing (midnight to midnight) in New York, Atlanta, and Chicago. In each case, the temperatures moderated far more quickly than was the case during some of the most intense cold waves of the last 40 years.
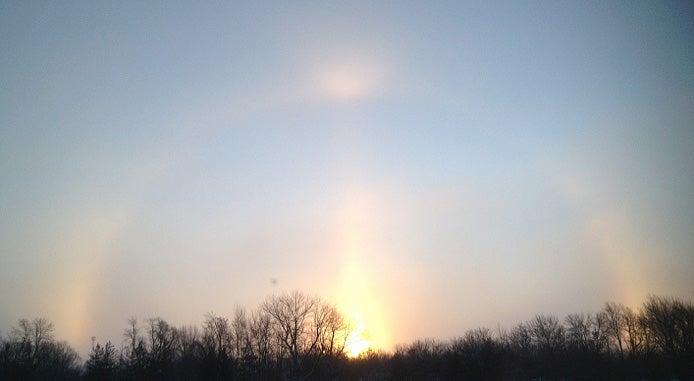
UCAR member representative Ernest Agee (Purdue University, Department of Earth, Atmospheric and Planetary Sciences) took this photo in Tippecanoe County, Indiana, as temperatures dipped to –15°F near sunrise on January 6, 2014. As sunlight struck hexagonal ice crystals in the air, it allowed for the formation of sun dogs (at the sides), a solar pillar (center), and a halo extending from the sun dogs to an upper arc (top). Portions of the color spectrum can be seen in the sun dogs. This diagram provides more explanation. (Photo courtesy Ernest Agee.)
Duration of heat and cold is an important index of how weather affects us. Heat waves are more likely to be deadly when temperatures remain stifling for several nights in a row, which prevents people and buildings from getting overnight relief. Prolonged cold waves can have their own impacts on people and services.
The number of days below freezing is only one of many possible approaches to assessing the impact of winter weather as a whole. A Climate Central analysis last week showed how the total number of nights per year that dip below certain temperature thresholds has declined in several U.S. cities since the 1970s.
Many recent papers have analyzed how episodes of heat and cold have evolved in recent decades and how they might change in the future. A report from the Intergovernmental Panel on Climate Change, finalized in November, projects that heat-wave frequency and duration will continue to increase globally in the 21st century, although this Working Group I report does not weigh in on cold-wave duration. “It is virtually certain that there will be more hot and fewer cold extremes as global temperature increases,” notes the report.
For the United States, a recent article in the Bulletin of the American Meteorological Society shows pronounced variations over the last century. Cold waves were most prevalent in the 1980s and much less common in the 2000s, while heat waves were most frequent in the 1930s, with the 2000s as runner-up. The report is based on a workshop held in conjunction with the U.S. National Climate Assessment, whose official report will be issued later this year.
As evidenced by the latest IPCC report, the picture painted by research into future changes in cold waves, including duration, is a bit less clear-cut than for heat waves. Adding further to the mix is a recent debate over whether changes in Arctic sea ice might be affecting midlatitude weather, including wintertime outbreaks of cold. All this makes the future of cold waves a ripe topic for future work on how a changing climate could affect society.
Update (January 15): The graphics below are based on comparisons originally carried out by Brandt Maxwell (NOAA National Weather Service). It's also worth emphasizing that the graphics are meant to be illustrative rather than comprehensive. Not every cold wave from the 1970s–90s is included. Some cold outbreaks, then as now, were quite brief. But while shorter periods below freezing have continued to occur, as in the 2014 Arctic blast, the more prolonged ones appear to be becoming more scarce—at least for the cities below.