A super forecasting challenge
What can we say about Super Bowl weather two weeks out?
Jan 1, 2014 - by Staff
Jan 1, 2014 - by Staff
Bob Henson • January 16, 2014 | Let’s set aside the outcome of the upcoming Super Bowl XLVII for a moment—for example, how an offense built around a traditional pocket passer will compare with one that uses a new-school quarterback who can run. Instead, let’s look at another critical issue: will it snow on game day?
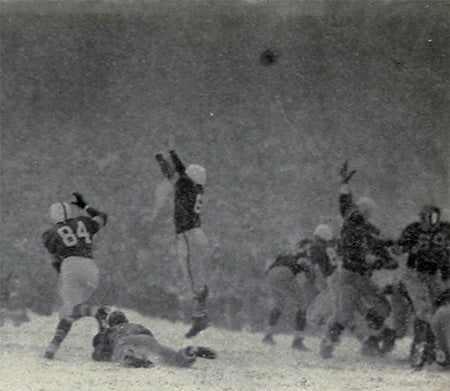
Snow can torque college and professional football matchups alike. The "Snow Bowl" of November 25, 1950 (above) is one of the most famous games in the long rivalry between Michigan and Ohio State. Less than two years earlier, on December 19, 1948, the first televised National Football League championship unfolded during a snowstorm that forced players from both teams—the Chicago Cardinals and the Philadelphia Eagles—onto the field to remove the snow-covered protective tarp. (Wikimedia Commons image)
Next month’s Super Bowl will be the first ever held in an open stadium in the northern United States. As a result, meteorologists, climatologists, and almanac writers have been weighing in on what might, could, or will happen weatherwise in New Jersey’s MetLife Stadium on February 2.
Most people realize that local weather forecasts become increasingly unreliable more than a few days out. Thus, attempting to predict specific weather a month or two ahead may not be worth the effort except as a parlor game.
However, now that it’s just over two weeks from kickoff, we’re in a more interesting time window—a place where weather forecasts, seasonal predictions, and climatological guidance intersect.
So let’s consider two questions:
At Newark Liberty International Airport—the major weather observing site most representative of MetLife Stadium—the average high and low for February 2 are 40°F and 25°F. The average temperature at 6:00 p.m. EST, just before kickoff time (6:30 p.m.) is 34°F. Over the period from 1931 to 2013, all but a handful of February 2 dates had 6:00 p.m. readings between 19°F and 51°F. Much more data can be found at biggameweather.com, a website being operated by the Office of the New Jersey State Climatologist.
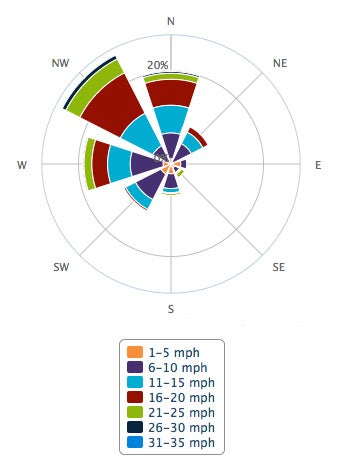
This "wind rose" depicts how often the wind has blown from various directions and speeds on February 2 at Newark, New Jersey, during each year from 1931 to 2013. When strong winds do occur, they are typically from the west, northwest, or north. (For an interactive version of this chart, see www.biggameweather.com.)
As for the burning question on the minds of millions—will it snow?—the website examines the seven days surrounding February 2 (January 30 to February 5). During this window, at least 0.1” of snow has fallen on about 15% of all days since 1931. The likelihood of 1.0” or more dips to 6%, and only about 1% of the days have seen more than 6.0”. On February 2 itself, the largest snowfall on record is 3.4”.
In theory, we could go one step further in certain years by looking to phenomena such as El Niño to see if the climatological odds might shift. In some parts of the country, the presence of El Niño or La Niña can make a given winter more likely to be wetter, drier, warmer, or cooler than normal. However, there’s no El Niño or La Niña under way this winter, so the point is moot.
Someday, long-range forecasts may be able to factor in the North Atlantic Oscillation, which can also shape the odds of cold and snow across the U.S. Northeast. At the moment, however, the NAO is itself difficult to predict beyond a few days.
If you want to go beyond climatology into specific prediction of Super Bowl weather, you’ll need to be patient. Forecasts of both local weather and large-scale features have improved steadily over the last few decades, thanks in large part to enhanced data collection by satellites and ever-improving computer forecast models. But beyond more than a week or so in advance, such model guidance should be taken with at least a few grains of salt.
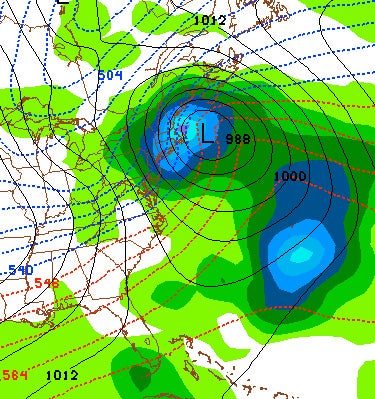
A very long-range computer model run simulates a strong winter storm over the northeastern United States at 7 a.m. on Saturday, February 1. This 384-hour forecast run was produced today by the National Weather Service's Global Forecast System operational model. Although the storm appears ominous, long-range models can vary widely from one run to the next. (Image courtesy NOAA/NWS/NCEP.)
The National Weather Service simulates the atmosphere out to 384 hours (16 days) with model runs that are updated four times a day. These feed into the NWS outlooks for 6–10 days and 8-14 days, which include maps depicting the odds that temperature and precipitation will be above or below normal.
The main tool used for extended-range forecasting by the NWS is the Global Forecast System model. At left is the 384-hour GFS forecast of surface weather features based on data from 12Z (7 a.m. EST) on Thursday, January 16, and valid at 12Z on Saturday, February 1.
Ominously, the model output shows heavy precipitation from the New York City area across New England, with temperatures cold enough for snow.
However, there's more to the story. In addition to the “operational” run above, each GFS cycle includes an ensemble of 20 other runs, each at lower resolution (to save on computing time and cost). All are produced at the same time, but with slightly varied starting-point conditions that mimic the uncertainty in our still-limited observations. Typically, the ensemble members start out closely aligned but then deviate from each other within a few days.
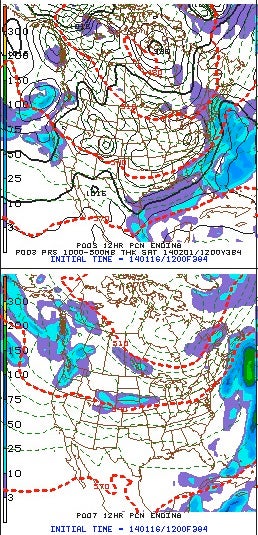
The 384-hr forecast from the operational GFS (see previous image) differs from many of the ensemble runs carried out for the same time period, including these two (top and bottom panels above). (Image of NOAA model output courtesy The Electronic Map Wall, Pennsylvania State University.)
The two examples shown at right, both valid for the same time as the main GFS forecast above, illustrate how members of an ensemble can differ markedly from each other in the long range.
This tells us that we shouldn’t put too much stock in any single model prediction two weeks out—including the operational run pictured above. Even the official NWS local forecasts that go out seven days need to be viewed with skepticism at the far end, since their skill is little better than climatology at that point.
It’s also important to distinguish between “skill” and “accuracy.” One could offer a firm prediction of “no snow” a month in advance for the Super Bowl, and chances are greater than 80% that the forecast would be correct—but not necessarily skillful, in the sense that climatology alone could have given you a similar answer.
Part of the credit for this state of affairs goes to atmospheric chaos. Its importance was identified by Edward Lorenz, the famed physicist and frequent NCAR visitor based at the Massachusetts Institute of Technology. Lorenz theorized that weak, random elements in the atmosphere would eventually grow in scope until they dominated any useful signal from a forecast model. At first Lorenz didn’t specify the outer range of potentially useful prediction, but later he speculated it might be around three weeks, perhaps a bit less.
Research continues to back up chaos theory, according to Grant Branstator, an NCAR scientist who has studied longer-term forecasting.
“Studies consistently show that in typical situations, one cannot have any skill for predictions of individual days if the predictions are longer than about two weeks,” says Branstator. “This is not because models are poor approximations to nature. Even a perfect model would have this limit. This is a physical constraint that anyone attempting to make 16-day predictions cannot ignore.”
Branstator and some colleagues do see a glimmer of hope that at least some useful information can eventually be gleaned two weeks or more out. A recent study led by NCAR’s Haiyan Teng offers one example with respect to U.S. heat waves. Teng, Branstator, and colleagues found that if a particular upper-level circulation pattern happens to be unusually strong, then the chances of a Great Plains heat wave occurring two weeks later are greater than normal. If the pattern is four times stronger, then the odds of a significant heat wave are also boosted fourfold, from about 2.5% to 10%.
“Even under these unusual conditions, when the system may be unusually predictable, we can still only say there is a 10% chance of a heat wave,” notes Branstator.
Researchers are also looking into another factor that could help provide some skill in predictions beyond two weeks: the connection between tropical rainfall and subsequent weather patterns. It may seem like a long shot to associate showers and thunderstorms over the Indian Ocean with storms over the United States. But scientists are zeroing in on a periodic disturbance, the Madden-Julian Oscillation (see this QuickTime movie). MJO events move from the Indian Ocean across the globe, persisting and affecting weather patterns for weeks at a time.
For example, the approach of an MJO disturbance during hurricane season substantially raises the odds of a tropical cyclone in the Gulf of Mexico and western Caribbean. And in winter, the onset of an MJO event in the Indian Ocean is associated with the location and severity of major storms on the west coast of North America that occur about 10 days later.
"If you can find out how an MJO event starts, you may get a couple of weeks’ warning about wintertime storms in the United States," says NCAR scientist Mitchell Moncrieff, who focuses on long-term forecasting challenges.
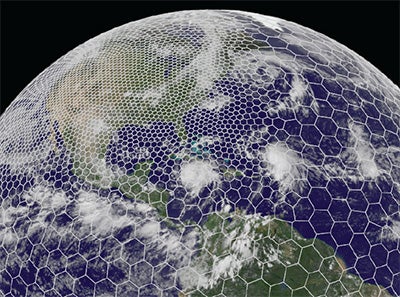
The variable-mesh MPAS grid can be customized to feature higher resolution where added detail is desired, as illustrated here for North America. (Image courtesy MPAS.)
In order to learn more about such atmospheric connections, scientists need better observations and computer simulations. One of the new tools drawing interest is the Model for Prediction Across Scales, developed by NCAR and the U.S. Department of Energy and made available to the research community last year. It enables scientists to run computer simulations of the entire globe while focusing on specific geographic regions. In recent tests, MPAS successfully depicted a cluster of severe Midwest thunderstorms more than four days out, and tropical cyclones in the Pacific up to six days in advance.
Across the community of researchers, there are differing opinions on how much progress can be realistically expected for predictions beyond two weeks. Many scientists warn that even perfect tools would hit a wall of chaos that would render detailed local forecasts meaningless beyond that point. Other researchers assert that it may be possible someday to anticipate some aspects of general weather patterns, at least in a probabilistic sense, more than two weeks out.
“Extending the prediction of weather extremes beyond the two-week range is an international grand challenge,” says Moncrieff. “Progress in this area is crucial to help decision makers prepare for potentially damaging weather events.”
Even if today’s long-range models were extremely reliable in terms of the flow of major weather features 16 days out, ponder this point: just a half day of error (or only about 3% in terms of timing) could spell the difference between sunshine and snow, assuming a fast-moving weather system were in the area. This alone should make us cautious about taking any specific forecast too literally until we get within a few days of an event.
At least through 2018, there are no more Super Bowls scheduled for an outdoor northern stadium. As for the 2014 edition, the National Football League promises that the game will be rescheduled if a forecast of heavy snow materializes. For now, no one can say for sure if that will happen. But at least the climatological odds of just a 6% chance of more than an inch of snow should give some warm comfort to fans.