Forecasting the big game: 1967 vs. 2014
Meteorologists have gained more than just yards since the first Super Bowl
Jan 1, 2014 - by Staff
Jan 1, 2014 - by Staff
David Hosansky • January 27, 2014 | Now that we’re within seven days of the Super Bowl, we can actually start getting official National Weather Service forecasts for the big game. At the moment, NWS forecasters are calling for a high that day of 39 and mostly cloudy. (Of course, there are other sources of local forecasts that may differ, including TV weathercasters and private firms.)

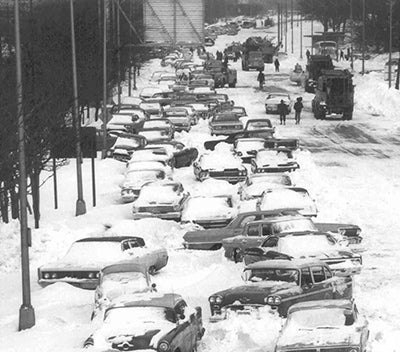
Chicago's Lakeshore Drive was clogged with stranded cars in the wake of the city's record-setting blizzard on January 26–27, 1967. Forecasts at the time strugged to predict such events. (Image courtesy NWS/Chicago.)
If the NWS forecast holds—and it should be noted that forecasts are notoriously challenging so far in advance—this means the first outdoor Super Bowl in a northern city won’t have to be postponed.
But NFL officials would have no idea what to expect if weather predictions today were as primitive as they were at the time of the first Super Bowl in 1967. Perhaps that’s why they played it safe and scheduled that game in Los Angeles.
Back at the time of Super Bowl I, forecasts from the U.S. Weather Bureau (the forerunner of today’s NWS) went out just 48 hours. Without advanced satellites and dual-polarization radar systems, high-end supercomputers to run models of the atmosphere several times a day, and the decades of research that has shed light on the oceans and cloud microphysics and so many other factors that influence our atmosphere, people had very little idea of what the weather was going to be like beyond tomorrow.
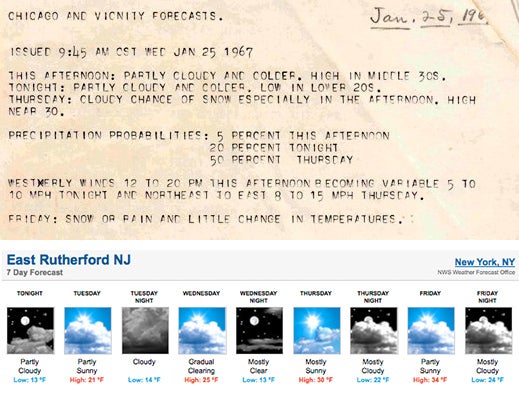
Consider this forecast for a late January afternoon in Chicago, just a few days after that first Super Bowl:
Issued at 345 PM
Wednesday January 25th
Thursday...Cloudy with rain or snow likely.
High in the 30s.
Northeast to east winds 10 to 18 mph.
Chance of precipitation 50 percent.
Thursday Night...Rain or snow likely.
Low in the lower 30s.
Chance of precipitation 50 percent.
Friday...Rain or snow ending.
None of the detail that we’ve become accustomed to. Nothing about how much rain or snow might fall, let alone whether the rain would likely turn to snow overnight or when the heaviest precipitation could be expected. And nothing extending into the weekend.
A few hours later, forecasters provided a bit more detail, warning of a greater than 90 percent chance of precipitation in 24 hours and hazardous driving conditions. On Thursday morning, they predicted that it would snow four inches or more Thursday afternoon.
And that was it. Residents had little warning that Chicago was facing its worst blizzard on record. That the city would be hammered by 23 inches of snow with 4-6 foot drifts. That 60 people would die, O’Hare Airport would be closed for three days, and the area would suffer more than $1 billion of damages in today’s dollars.
Can we take a moment to celebrate how much weather forecasts have improved since the time of the first Super Bowl?

In 1967, forecasts from the U.S. Weather Bureau (the forerunner to today's National Weather Service) extended out only 36 to 48 hours. They were transmitted by teletype to other government agencies and the news media, reaching the public through newspapers, radio, and TV. Today, forecasts from both private and public sources—such as the NWS outlook shown above for the vicinity where Super Bowl XVIII will be played—are available 24/7 through computers and smartphones. (Top image courtesy Chicago Weather Center and americanwx.com; bottom image courtesy NWS.)
While there are certainly forecasts that go awry, the public is far better prepared than ever. Computer models go out as far as 16 days, and meteorologists can begin to get a feel for the possibility of some major weather events, if not their precise location or timing, 10 days or more in advance. In 2012, the extremely unusual track of Superstorm Sandy, with its left turn into New York and New Jersey, was first suggested by one computer model six days before the storm’s devastating landfall.
Researchers are making sure that the improvements are going to continue. Here are a few new developments by NCAR and their collaborators at universities and government labs into advancing both short- and long-term forecasts:

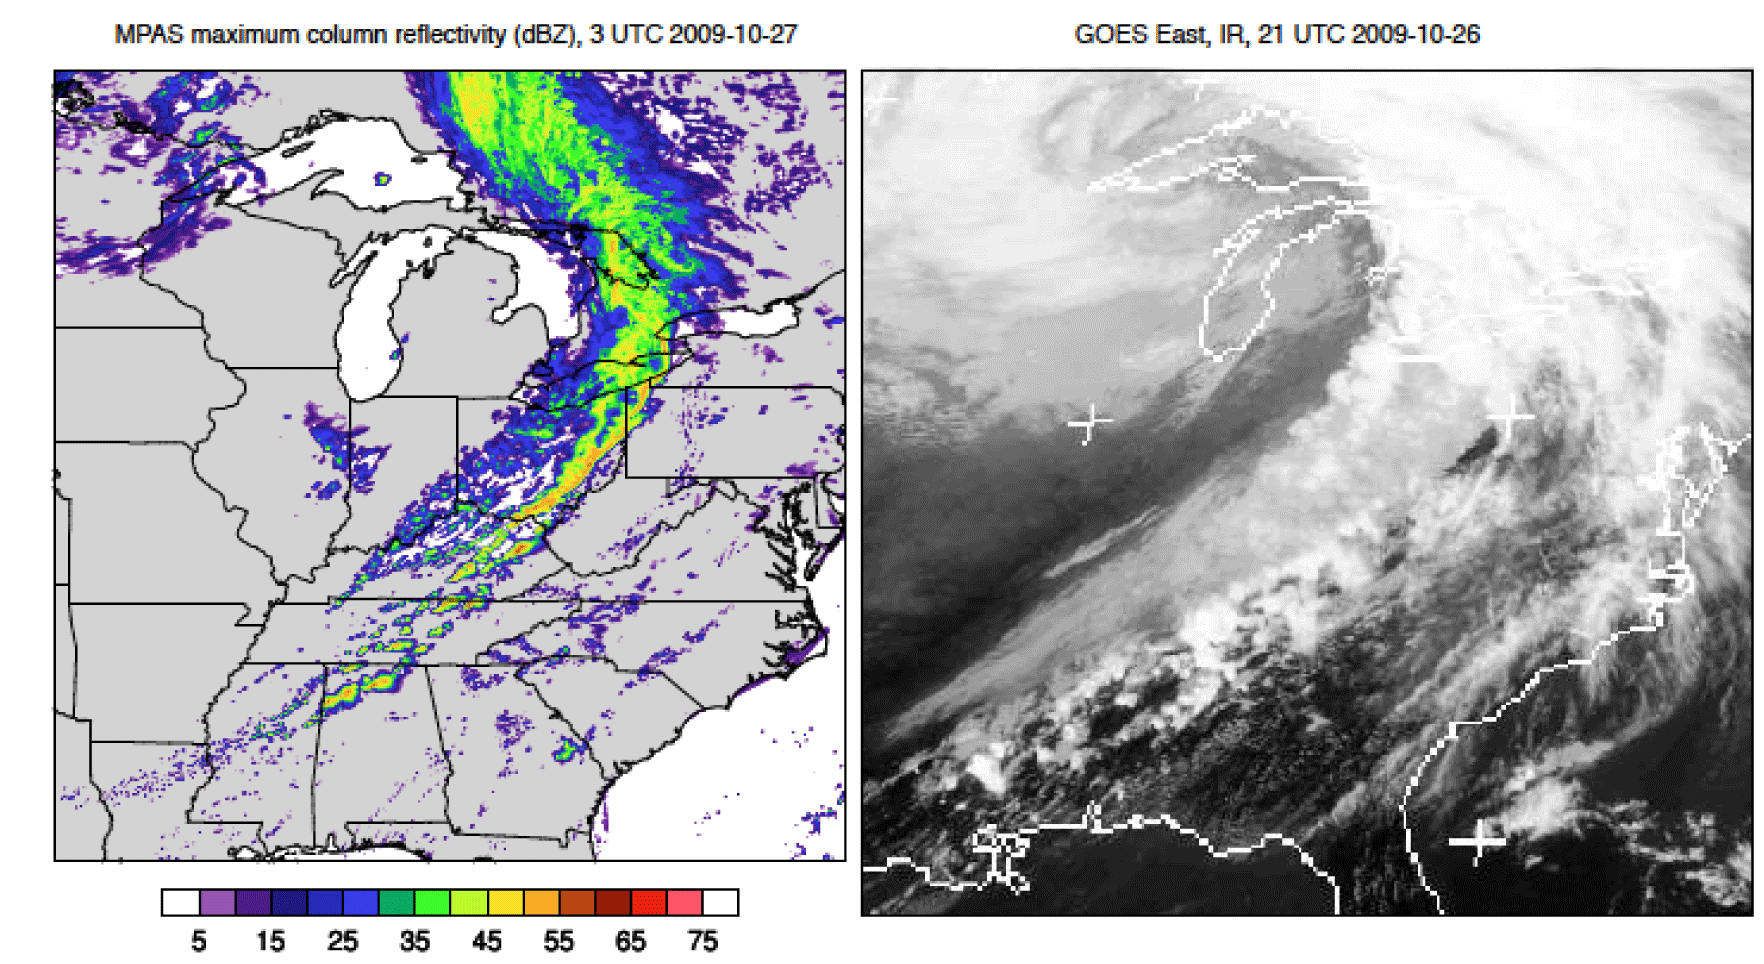
A broken line of supercell thunderstorms that produced tornadoes across parts of the eastern U.S. on the afternoon and evening of September 26, 2009 (see satellite image at right) was well forecast by the high-resolution NCAR/DOE Model for Prediction across Scales (left), based on conditions four days earlier. Known as a "hindcast," this forecast was created after the event from the observations available prior to the event in order to test the forecasting power of MPAS. (Image courtesy MPAS.)
And that’s just weather. NCAR researchers and their collaborators are also making strides into predicting the behavior of long-lived wildfires, guiding aircraft away from turbulence more effectively, and forecasting air quality over specific areas several days in advance.
There are limits to what we can predict. The atmosphere may be too complicated for meteorologists to ever confidently forecast, for example, what the weather will be like in three weeks over 100 yards of turf during the time of kickoff. And scientists warn there will always be forecasts that go awry.
But the scientific progress since Super Bowl I in 1967 seems likely to continue for some time. We don’t know what football is going to look like in a few decades—how strategies may change, whether the extra point will continue to be part of the game. But if the NFL plans again to hold the Super Bowl in a cold-weather venue, the forecast is for better and better prediction.