A deeper dive into 21st-century climate
Exploring a wider range of climate scenarios in a cost-effective way
Jun 3, 2014 - by Staff
Temporary impacts to NSF NCAR Road, Parking Lot and Trails
View more information.Jun 3, 2014 - by Staff
June 4, 2014 | Twice as much flour and water should give you twice as much bread. Earth’s atmosphere doesn’t respond to greenhouse gases quite that simply. But researchers are finding new ways to work with some aspects of climate change that are surprisingly linear.
This work could point the way to saving time and money in future climate research while producing a richer set of studies—and a richer range of information for policy makers—on various climate change scenarios and how society might mitigate and/or adapt to the changes.
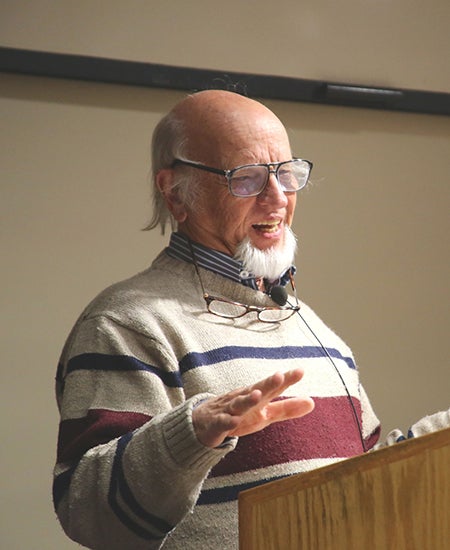
NCAR senior research associate Tom Wigley, now at the University of Adelaide, delivered a keynote address at NCAR on April 23 as part of a workshop on approaches to pattern scaling. Wigley teamed with Benjamin Santer (Lawrence Livermore National Laboratory) in 1990 on the first paper describing the technique of pattern scaling. Wigley’s MAGICC/SCENGEN software package, which uses the technique to allow researchers to scale model output for various emissions levels, has been downloaded by thousands of users. (©UCAR. Photo by Bob Henson. This image is freely available for media & nonprofit use.)
Several dozen experts gathered at NCAR in April to discuss “pattern scaling,” one of several statistical approaches that allow scientists to interpolate between two highly detailed simulations and get simpler but still-useful results that fill in the gap between them. Pattern scaling is designed to map out how climate might evolve if emission pathways differ from those that have been studied intensively through full simulations with global climate models.
Part of the challenge in preparing for climate change is that it can take thousands of hours of costly supercomputer time to produce a single projection of how climate might unfold over the next century. Moreover, nobody knows the extent to which nations and industries might act to stem the rise of greenhouse gases.
Because of this, it takes multiple simulations—with emissions allowed to plummet in some runs and to grow unchecked in others—in order to provide a broad range of possible trajectories for global climate.
For example, the modeling carried out for the recent Fifth Assessment Report from the Intergovernmental Panel on Climate Change involved four different “representative concentration pathways.” Each of these RCPs specify the amount of carbon dioxide in the atmosphere expected by a certain point (such as the year 2100) (see graphic).
Pattern scaling aims to fill in the gaps between these simulations. The technique could assist policy makers who want to know the impacts of a different emission level, such as something in between two of the four existing RCPs. It’s also widely used in other types of research on climate impacts.
Pattern scaling appears most effective in projecting changes at large regional scales, where scientists expect a climate model to be most skillful. For example, it’s well established that emitting more greenhouse gases will tend to make subtropical areas drier and subpolar regions wetter. The models also show polar regions warming more quickly than lower latitudes, a trend already being observed. These changes should be roughly proportional to how much global average temperature rises, which in turn is a function of how much total greenhouse gas is emitted. The latter relationship is easily simulated with very simple and inexpensive models. Pattern scaling allows those results to be translated into projections of future climate change across large regions in a computationally efficient way.
Not all phenomena lend themselves to the pattern-scaling approach. It doesn’t capture the effects of internal (natural) climate variability, which can temporarily mask the signal of human-caused changes. As an example, much of the southeastern United States has seen little temperature rise over the last century. Climate models didn’t predict this regional “warming hole,” since they’re not designed to track the ups and downs of internal variability. It’s also difficult to use pattern scaling to determine how quickly the warming hole will diminish, as it’s eventually expected to do. Pattern scaling also has its limits when warming pushes climate past a major threshold, such as the melting of Arctic summertime sea ice.
Participants came out of the workshop agreeing that it’s time for a more thorough evaluation of pattern scaling. They want to determine where and how pattern scaling might be used more extensively. For example, it could play a role in research leading up to the next major assessment from the Intergovernmental Panel on Climate Change.
“Pattern scaling can’t completely replace the need for comprehensive Earth system model runs, but perhaps we can rely on it more than we think we can now,” says NCAR scientist Brian O’Neill, who helped coordinate the workshop.
|
Writer/contact Workshop coordinators |
Funders |
Workshop website: "Pattern Scaling, Climate Model Emulators, and their Application to the New Scenario Process," April 23-25, 2014
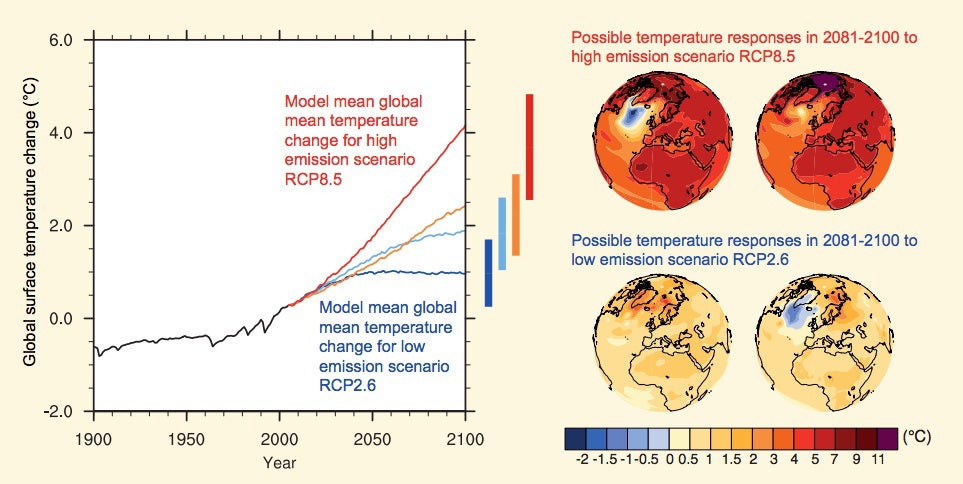
Pattern scaling helps researchers interpolate between results from widely differing model scenarios, including the four representative concentration pathways (RCPs) used in the 2013-14 Fifth Assessment Report from the Intergovernmental Panel on Climate Change (IPCC). This image is drawn from FAQ 12.1 in Chapter 12 of the Working Group I report. Left: Global mean temperature change averaged across all Coupled Model Intercomparison Project Phase 5 (CMIP5) models (relative to 1986–2005) for the four RCP scenarios: RCP2.6 (dark blue), RCP4.5 (light blue), RCP6.0 (orange) and RCP8.5 (red); 32, 42, 25 and 39 models were used respectively for these four scenarios. Likely ranges for global temperature change by the end of the 21st century are indicated by vertical bars. (Note that these ranges apply to the difference between two 20-year means, 2081–2100 relative to 1986–2005, which accounts for the bars being centered at a smaller value than the end point of the annual trajectories.) Right: For the highest (RCP8.5) and lowest (RCP2.6) scenario, these maps show examples of surface temperature change at the end of the 21st century (2081–2100 relative to 1986–2005) from two CMIP5 models. These models are chosen to show a rather broad range of response, but this particular set is not representative of any measure of model response uncertainty. (Image courtesy IPCC.)