A new way to forecast floods
Integrated system put through its paces in summer test
Aug 26, 2014 - by Staff
Early closure on July 3 and 4 - NSF NCAR Road, Parking Lot and Trails
View more information.Aug 26, 2014 - by Staff
August 27, 2014 | Almost a year after Colorado’s deadly and destructive floods of September 2013, a group of NCAR scientists has just completed testing an innovative new system for detecting and predicting torrential rainfall as well as the risk of local flooding.

A bike/pedestrian path along Bear Creek in south Boulder—normally a placid thoroughfare—was engulfed by flood waters on the afternoon of September 12, 2013. (Photo by Bob Henson, UCAR. This image is freely available for media & nonprofit use.)
A full evaluation of the summer test will take place over the next few months. For now, the researchers are pleased with how well the system pegged several heavy rain events and streamflow responses to that rainfall. Most importantly, they say, the disparate tools that were interwoven for the first time worked together just as envisioned, leading to a whole that’s potentially much more powerful than the sum of its parts.
“Our effort was to integrate all these components in order to get a better view of evolving weather as well as its impact on the ground,” said Rita Roberts, one of the principal investigators in the STEP Hydromet Experiment (Short-term Explicit Prediction). See box below for a summary of the elements incorporated in the end-to-end system
The project brings together advanced weather forecasting tools with hydrologic models in new ways, providing a detailed prediction of rainfall as well as how it may affect streams and rivers. This type of approach may, in time, lead to improved forecasts of when and where heavy rains and flash floods are likely to occur and how severe the flooding will be. The ultimate goal is better guidance for decision makers and the public during the crucial 1-to 12-hour window, when there is still ample time for people to seek safety and emergency management tools to be deployed.
![]()
Update: 2015: NCAR and its research partners have developed two new prediction systems — one for wildfires and one for floods. The systems can provide public safety officials with detailed, 12- to 24-hour predictions of these destructive disasters. The fire prediction system can also help guide tactics for prescribed burns. Learn more in this YouTube video. (©UCAR. This video is freely available for media & nonprofit use.)
The Front Range of Colorado, epicenter of last year’s flooding, was the focal point of this year’s STEP testing, which played out from July 7 to August 15. The system could eventually be adapted for other areas where flash flooding is a major threat.
Computer forecast models have grown in number and sophistication over the last few years, giving human forecasters far more guidance on precipitation than ever before. This may be a mixed blessing, however, because the forecasters now must consider a broader, more complex range of input under intense time pressure.
The 2014 STEP summer experiment drew on an unusually wide set of forecasting tools that were combined to produce a uniquely integrated hydrometeorological prediction system. It includes:
—Estimates of area-wide precipitation based on quality-controlled radar data and rain-gauge reports
—Fine-scale computer model forecasts of rainfall, based on the Weather Research and Forecasting system (WRF), that incorporate radar data and foresee storm development out to 12 hours, with updates as often as once an hour
—The Auto-nowcaster, a software program that projects how the strength and location of existing storms and the amount of accumulated rainfall will evolve over the next 10 minutes to one hour
—Streamflow analyses and predictions at a resolution of 100 meters based on the WRF-Hydro model, which links atmospheric and hydrologic conditions
—Evaluation of how well the system and its components are performing, using a variety of statistical techniques
This challenge came to light during the Colorado flooding. The amount of moisture in the atmosphere over Denver was at a record high for any September day on the morning of the 11th, just hours before the heaviest rain began. Computer models had already picked up on the potential, with some showing the possibility several days in advance that rains of 4” or more could occur in localized areas. However the models weren’t consistent on the exact location or magnitude strength of the heavy rain, as noted in a National Weather Service (NWS) assessment released in June (see PDF).
Similar challenges emerged this summer with a spate of record-breaking rainfall events across the country that has underscored the importance and difficulty of predicting localized torrents and floods. As an upper-level storm moved across the Midwest and Northeast in mid-August, Detroit and Baltimore each saw their second-heaviest one-day rainfalls on record. Islip, Long Island, received 13.57”, a new 24-hour record for the state of New York (pending official confirmation). All three locations saw massive disruption, with tens of thousands of homes flooded in the Detroit area alone. A few days later, major flooding occurred north of Phoenix, with some areas receiving more than 5” of rain in several hours.
In the Long Island event, some computer models had shown the potential for heavy rain days in advance, but as was the case with model projections in Colorado, there was considerable uncertainty on the location and magnitude of the heaviest rain, which developed along a sharply focused strip across western and central Long Island.
“There’s still a lot of research ahead to see why the heaviest rainbands align the way they do in events like this,” said Roberts.
The STEP project is exploring several ways to improve model projections of heavy rain and flooding. One is to see which method of incorporating radar data—a process called data assimilation—yields the best model forecasts of rainfall.

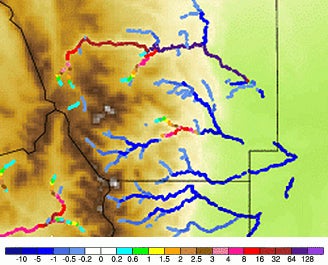
Using radar data, the STEP system estimated the amount of rainfall that accumulated over northeast Colorado for the hour ending at 5:15 PM MDT on June 14, 2014. (Image courtesy STEP/Rita Roberts.)
A growing number of high-resolution forecast models can now depict individual showers and thunderstorms (convection), rather than simply estimating their timing and frequency. These convection-permitting models perform best when they are steered by radar data that is frequently updated. According to Jenny Sun, who manages the overall STEP program at NCAR, this summer’s test is the first time that several such models have been run side by side in a real-world setting.
“Without accurate, quantitative forecasts of precipitation, the streamflow forecasts will not be very useful,” says Sun.
Another major goal of the STEP Hydromet Experiment is to get estimates of short-term storm evolution into hydrologic models as quickly and accurately as possible. The hydrologic models typically used to predict streamflow have often relied on fairly simple estimates of where storms might move. The STEP project is employing NCAR’s Auto-nowcaster, which goes beyond basic extrapolation to predict the growth and decay of storms over periods from 10 minutes to an hour.
The WRF-Hydro model uses observations and model-generated weather forecasts to predict streamflow behavior in the crucial 0-to-12-hour period. Above are one-hour WRF-Hydro forecasts of streamflow across parts of Larimer, northern Boulder, eastern Grand, and western Weld counties in northeast Colorado, issued at 11 p.m. MDT on August 13, 2014, and valid at midnight. The values (cubic meters per second) are shown as departures from the average streamflow over the previous 10-day period. (Image courtesy STEP/David Gochis.)
One of the system’s main advances is the ability to generate quantitative streamflow predictions in the 0-to-12-hour time frame. While such forecasts are common for some locations along particular rivers, they are seldom issued for smaller waterways where localized heavy rain can trigger a dangerous flash flood quickly.
Along with drawing on work from several NCAR groups, the STEP study also employed the NCAR-Wyoming Supercomputing Center. Output from the weather forecast models was routed to the Yellowstone supercomputer in Cheyenne, where it was brought into a sophisticated hydrology-oriented version of the Weather Research and Forecasting model, dubbed WRF-Hydro.
“It will take time to provide a more comprehensive analysis of the fidelity of the system and the components, but I can safely say we have made a lot of progress,” said NCAR’s David Gochis, another principal investigator on the project.
Even with major improvements, we shouldn’t expect tomorrow’s forecast systems to capture the most unusual events with pinpoint accuracy. The Colorado rains of September 2013 were exceptionally heavy over a large area. The observed totals of 15–18” across much of central Boulder County for the week of September 9–16 would be expected to recur less often than once in a thousand years, according to rough estimates from a NOAA database (see PDF).
“Certainly the models predicted heavy rain, but the magnitude of the Front Range event of 2013 would have been really challenging for any model to predict,” said Roberts. “What we’re shooting for is higher specificity on more localized rainfall events, especially over higher-terrain watersheds. We want more accurate analysis and prediction of where the rainfall is and where it will be, so that we can feed that into the hydrologic models.”
On August 14, for example, residents of Longmont were rattled by 1.15” of rain that fell in an hour’s time, the city’s heaviest downpour since last September’s devastating flood. The STEP system caught the potential for heavy rain in the Longmont area and the resulting boost to water levels along the St. Vrain Creek. STEP researchers have a number of other noteworthy test cases to evaluate, including a total of seven events when at least 2” of rain were reported somewhere in the study area.
If this summer’s tests show real progress, it could point the way toward exporting the system to other areas at risk for heavy rain and flash flooding. Among several related efforts addressing this threat, NOAA paired meteorological and hydrologic models last summer in an experiment called FfaIR (Flash Flood and Intense Rainfall). Researchers at NOAA, FAA, and the University of Oklahoma are developing a precipitation estimation approach called MRMS (Multi-Radar, Multi-Sensor System). And scientists at the Polytechnic University of Catalonia (Barcelona Tech) have worked on developing short-term rainfall forecasts drawing on the Europe-wide EUMETNET radar network.
“Flash floods are a worldwide issue,” said Roberts, who participates in international efforts to address the problem. “Wherever I go, flash flooding and heavy rainfall are a top concern. At NCAR, we’re pulling together capabilities we’ve developed across the center and working to develop a system that can be used elsewhere.”
Quantifying progress in heavy rain and flood prediction can be a challenge in itself. For example, let’s assume that a forecasting system correctly predicts that an isolated storm will dump torrential rain, but the storm ends up one county away from where it was expected. That forecast would be considered a “bust” by many residents, as well as by traditional techniques that use a simple rain-or-no-rain scheme to assess forecast quality. Yet the forecast was clearly more skillful than one calling for either widespread rains or totally dry conditions.
NCAR’s Barbara Brown and colleagues have been developing more nuanced methods for assessing and identifying where forecast models demonstrate skill and where more work is needed. Using the example above, one could measure the amount by which a storm’s actual location or its intensity was offset from predictions, or compare the sizes and shapes of storms.
“The idea is to focus on looking at model performance from a spatial perspective,” Brown said.
Brown and colleagues will examine this summer’s results using a method developed at NCAR called MODE (Method for Object-based Diagnostic Evaluation). They’ll also explore the use of confidence intervals to determine exactly when a model improvement is statistically meaningful. Such tools may prove valuable in helping forecasters get the most value out of the wealth of model guidance now arriving regularly at their desktops. In turn, better forecasts should help decision makers and the public.
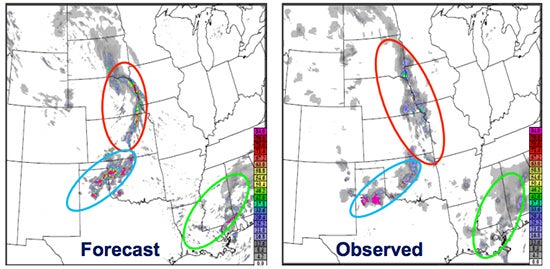
Why a good forecast can get bad marks: Although the predicted locations of precipitation (left) closely reflect where rainfall actually occurred (right), the small differences in location can lead to poor results when traditional methods of forecast verification are used. New techniques are evaluating how well the character of rainfall events is depicted, including the sizes and shapes of areas of rainfall. See PDF presentation for more detailed background. (Image courtesy Barbara Brown, NCAR.)
|
Writer Collaborating institutions Funders |
|