Progress on decadal climate prediction
Today's tools would have foreseen warming slowdown
Sep 8, 2014 - by Staff
Temporary impacts to NSF NCAR Road, Parking Lot and Trails
View more information.Sep 8, 2014 - by Staff
September 8, 2014 | If today’s tools for multiyear climate forecasting had been available in the 1990s, they would have revealed that a slowdown in global warming was likely on the way, according to new research.
The analysis, led by NCAR’s Gerald Meehl, appears in the journal Nature Climate Change. It highlights the progress being made in decadal climate prediction, in which global models use the observed state of the world’s oceans and their influence on the atmosphere to predict how global climate will evolve over the next few years.
Such decadal forecasts, while still subject to large uncertainties, have emerged as a new area of climate science. This has been facilitated by the rapid growth in computing power available to climate scientists, along with the increased sophistication of global models and the availability of higher-quality observations of the climate system, particularly the ocean.
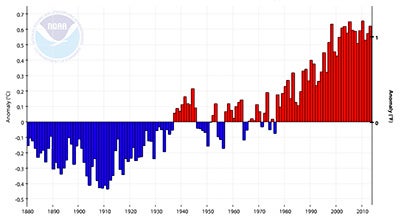
After rising rapidly in the 1980s and 1990s, global surface air temperature has plateaued at high levels since around 2000. (Image courtesy NOAA National Climatic Data Center.)
Although global temperatures remain close to record highs, they have shown little warming trend over the last 15 years, a phenomenon sometimes referred to as the “early-2000s hiatus”. Almost all of the heat trapped by additional greenhouse gases during this period has been shown to be going into the deeper layers of the world’s oceans.
The hiatus was not predicted by the average conditions simulated by earlier climate models because they were not configured to predict decade-by-decade variations.
However, to challenge the assumption that no climate model could have foreseen the hiatus, Meehl posed this question: “If we could be transported back to the 1990s with this new decadal prediction capability, a set of current models, and a modern-day supercomputer, could we simulate the hiatus?”
To answer this question, Meehl and colleagues applied contemporary models in a “hindcast” experiment using the new methods for decadal climate prediction. The models were started, or “initialized,” with particular past observed conditions in the climate system. The models then simulated the climate over previous time periods where the outcome is known.
The researchers drew on 16 models from research centers around the world that were assessed in the most recent report by the Intergovernmental Panel on Climate Change (IPCC). For each year from 1960 through 2005, these models simulated the state of the climate system over the subsequent 3-to-7-year period, including whether the global temperature would be warmer or cooler than it was in the preceding 15-year period.
Starting in the late 1990s, the 3-to-7-year forecasts (averaged across each year’s set of models) consistently simulated the leveling of global temperature that was observed after the year 2000. (See image at bottom.) The models also produced the observed pattern of stronger trade winds and cooler-than-normal sea surface temperatures over the tropical Pacific. A previous study by Meehl and colleagues related the observed hiatus of globally averaged surface air temperature to this pattern, which is associated with enhanced heat storage in the subsurface Pacific and other parts of the deeper global oceans.
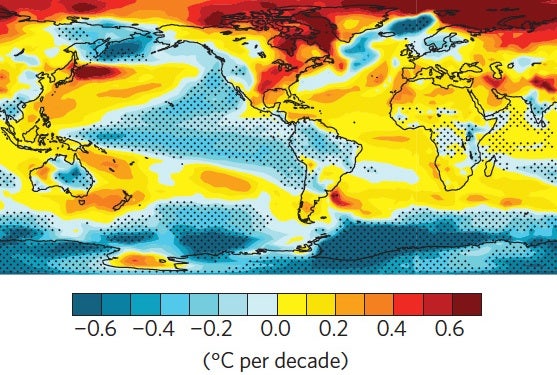
A set of 262 model simulations for the last century that were assessed in the most recent IPCC report show the long-term warming trend produced by greenhouse gases, along with short-term trends produced by natural variability. A total of 10 simulations randomly produced variations for the period 2000–2013 that were similar to those actually observed during this period. Above is a map showing trends in sea surface temperature for those 10 model runs, with the characteristic cooling evident across the tropical Pacific. (Image courtesy Nature Climate Change.)
Although scientists are continuing to analyze all the factors that might be driving the hiatus, the new study suggests that natural decade-to-decade climate variability is largely responsible.
As part of the same study, Meehl and colleagues analyzed a total of 262 model simulations, each starting in the 1800s and continuing to 2100, that were also assessed in the recent IPCC report. Unlike the short-term predictions that were regularly initialized with observations, these long-term “free-running” simulations did not begin with any particular observed climate conditions.
Such free-running simulations are typically averaged together to remove the influence of internal variability that occurs randomly in the models and in the observations. What remains is the climate system’s response to changing conditions such as increasing carbon dioxide.
However, the naturally occurring variability in 10 of those simulations happened, by chance, to line up with the internal variability that actually occurred in the observations. These 10 simulations each showed a hiatus much like what was observed from 2000 to 2013, even down to the details of the unusual state of the Pacific Ocean.
Meehl pointed out that there is no short-term predictive value in these simulations, since one could not have anticipated beforehand which of the simulations’ internal variability would match the observations.
“If we don’t incorporate current conditions, the models can’t tell us how natural variability will evolve over the next few years. However, when we do take into account the observed state of the ocean and atmosphere at the start of a model run, we can get a better idea of what to expect. This is why the new decadal climate predictions show promise,” said Meehl.
Decadal climate prediction could thus be applied to estimate when the hiatus in atmospheric warming may end. For example, the UK Met Office now issues a global forecast at the start of each year that extends out for a decade.
“There are indications from some of the most recent model simulations that the hiatus could end in the next few years,” Meehl added, “though we need to better quantify the reliability of the forecasts produced with this new technique.”
Meehl, Gerald A., Haiyan Teng, and Julie M. Arblaster, “Climate model simulations of the observed early-2000s hiatus of global warming,” Nature Climate Change (2014), doi:10.1038/nclimate2357
Writer/contact
Bob Henson, NCAR/UCAR Communications
Collaborating institutions
Center for Australian Weather and Climate Research
National Center for Atmospheric Research
Funders
Australian Bureau of Meteorology
National Science Foundation
U.S. Department of Energy Regional and Global Climate Modeling Program
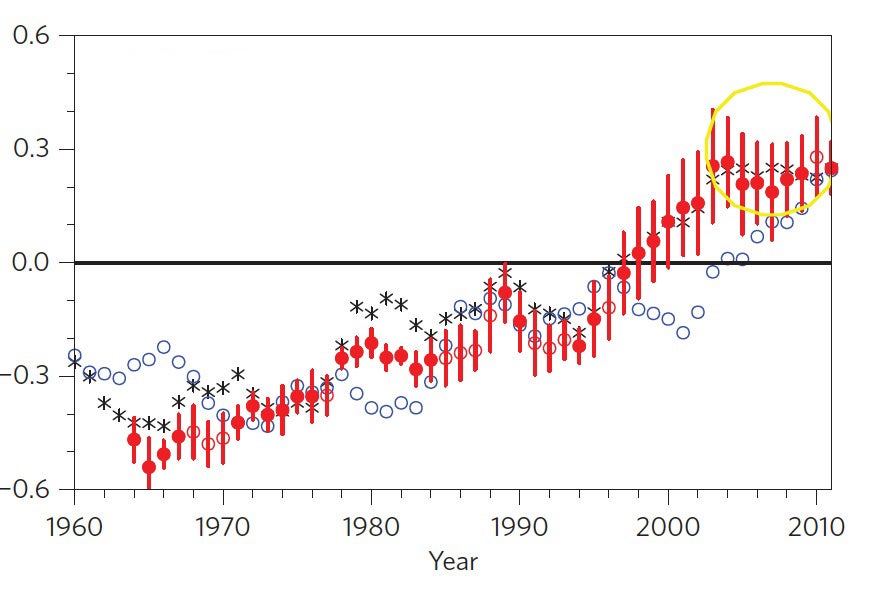
A series of "hindcasts" successfully captured the plateau in global air temperature observed in the last decade (yellow circle at right). Shown above are observed temperatures for each year (black asterisks) together with hindcasts (red circles) valid for a five-year period centered on each year. Each hindcast was issued based on conditions observed five years before the year indicated by the red circle. The red lines show the range of results for each set of hindcasts produced for that period. Blue circles show the forecasts that would have been produced by assuming the global temperature five years from now would be the same as today. Temperature anomalies for each year are shown relative to the average for the period 1986–2005. (Image courtesy Nature Climate Change.)