Scientists find clues to solar variability in observations of other stars
Telescope data about Sun-like stars indicate range of solar irradiance
Jun 15, 2020 - by David Hosansky
Jun 15, 2020 - by David Hosansky
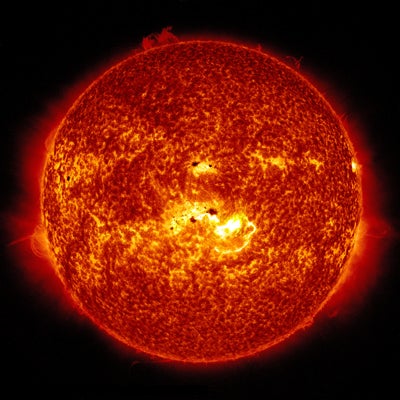
One of the fundamental questions for climate scientists is the extent to which solar output may vary in the future. The Sun's all-encompassing effect on Earth's atmosphere means that even slight changes in irradiance can have significant implications for global climate.
However, scientists can only hypothesize about the average magnitude of variability as the Sun moves from one approximately 11-year solar cycle to the next. They have amassed several decades of satellite observations. But although such observations are designed to be precise, they are not entirely accurate and cannot reveal potential changes in the Sun's output during past events such as the Maunder Minimum of the 1600s and early 1700s, a time of unusually low sunspot activity.
If observations of the Sun don't go back far enough in time to provide data about its variability, what options are left?
A team of researchers at the National Center for Atmospheric Research (NCAR) and Tennessee State University has come up with a novel approach. Rather than focusing on the Sun, they analyzed existing data from an array of telescopes trained at 72 Sun-like stars. By applying statistical techniques to the observations, taken from 1993 to 2017, they have assembled a picture of the Sun's variability that's statistically equivalent to observations stretching back to 1750.
"These long-term data sets of stellar observations can say important things about the stars, the Sun, and Earth's climate," said NCAR scientist Ricky Egeland, a co-author of a recent study about the research. "These are the kinds of observations that, if they continue, can improve our fundamental understanding of solar variability and Earth's climate."
The study, published in The Astrophysical Journal, was funded by the National Science Foundation, which is NCAR's sponsor.
The research team's initial findings indicate that variations in total solar irradiance since 1750 average 4.5 watts per square meter, or W m-2 (a standard measure used by climate scientists to measure the extent of solar heating of Earth's atmosphere).
The authors cautioned that this number will likely decline substantially with future observations because, statistically, the longer a variability is measured, the less its average changes over time in most cases. (To understand why, imagine that you're calculating the average change in daily high temperatures in a particular city. If you only measure two days, one in the winter with a high of 20 degrees and the other in the summer with a high of 90, then the average variation is 70 degrees. But if you keep measuring on the same days for years, that average variation will drop to less than a degree.)

Generating an accurate estimate of solar variation is critical to understanding the impact of different factors on global climate. Solar variability is currently estimated through crude extrapolations as ranging from -0.3 to +0.1 W m-2 since 1750 according to extrapolations by the Intergovernmental Panel on Climate Change. In comparison, societal emissions of greenhouse gases in recent years have an estimated heating impact of about
2.2 W m-2 since 1750, according to the IPCC.
The new technique may confirm the IPCC estimate of solar variation, or it could be used to refine it.
"By using this approach, you get more and more precise measurements of the stars as time goes on, and you get a better clue of how a star like the Sun is going to behave on timescales of 25 to 50 years, times when our children will be alive" said NCAR scientist Philip Judge, who co-authored the study.
The authors said that continued observations with the array of photometric telescopes at Arizona's Fairborn Observatory will provide improved long-term estimates of solar variability.
"These unique datasets represent the most precise measurements in existence of brightness variability in Sun-like stars," said co-author Gregory Henry of Tennessee State University, who has devoted the past 25 years to making these measurements with TSU's array of robotic telescopes in Arizona. "If we can continue making these observations for another decade or so, our datasets will become even more valuable to the quest to understand long-term climate variability on Earth."