Here comes El Niño—but what exactly is it?
A guide to El Niño, La Niña, and ENSO as research sharpens the picture
Dec 2, 2014 - by Staff
Temporary impacts to NSF NCAR Road, Parking Lot and Trails
View more information.Dec 2, 2014 - by Staff
December 2, 2014 | It’s been a fascinating journey, watching how scientific and public views of El Niño have evolved over the last several decades. Sometimes you still see El Niño portrayed as a devastating creature, guaranteed to wreak havoc on everything in its supposed path. But the picture has gradually grown more sophisticated as scientists have learned more about the workings of this vast, complex phenomenon and how to communicate its impacts effectively.
How did we get from there to here? A few landmarks stand out in the last 50 years of research and communication on El Niño, La Niña, and the El Niño–Southern Oscillation (ENSO). (For quick definitions of each of these, check out our Weather-Maker Patterns Glossary. For frequentlly asked questions, see the El Niño, La Niña & ENSO FAQ)
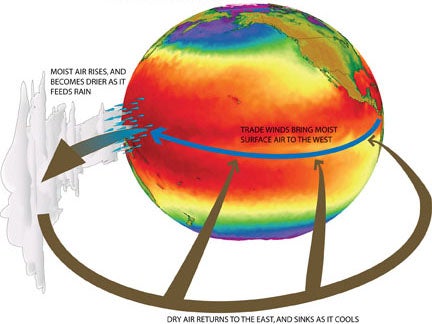
This diagram shows the Walker Circulation, a vast loop of air above the equatorial Pacific Ocean. (Illustration by Gabriel Vecchi, NOAA/GFDL.)
Scientists in the mid-20th century were aware of the tropical Pacific Ocean's Walker Circulation (see diagram), as well as a vast see-saw in atmospheric pressure—the Southern Oscillation—that modified this prototypical pattern. And people living near the coast of Peru and Ecuador knew that the cold upwelling that nourished their fish-packed coastal waters sometimes disappeared for months at a time, especially around Christmas (thus the local name “El Niño,” or “the Christ Child”).
These two phenomena were assumed to be unrelated until Jacob Bjerknes published a landmark paper in 1966 (see PDF). The concepts began to mesh further after a major El Niño event in 1972–73, when scientists began to draw firmer links between the oceanic warming of El Niño (which extended much further into the tropical Pacific than researchers had realized) and various atmospheric features that occurred across much of the globe (dubbed (“teleconnections”). The term El Niño–Southern Oscillation (ENSO) soon came into vogue. Pioneering social scientists such as Michael “Mickey” Glantz (then at NCAR, now at the University of Colorado Boulder) delved into the implications of El Niño for people on the ground and the potential usefulness of El Niño predictions for saving lives and livelihoods (see PDF, 1977).
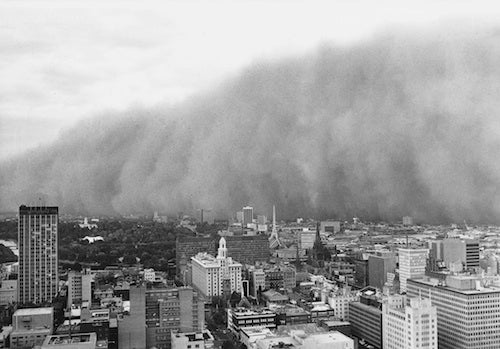
Extreme drought across Australia, fostered by a strong El Niño event, fed this wall of dust that swept across Melbourne on February 8, 1983. (Photo by Trevor Farrar, courtesy Australian Bureau of Meteorology and phys.org)
During the northern winter of 1982–83, the most intense El Niño recorded up to that time brought devastating winter storms to much of California and severe drought and wildfire to Australia, among other widespread impacts. Scientists recognized this event only after it had formed, due to limited observations, primitive computer models, the presence of simultaneous effects from a 1982 eruption of Mexico’s El Chichón, and an incomplete recognition of how El Niño development could vary from one event to another.
The next decade saw a concerted effort by the United States, Japan, and other nations to deploy instrumented buoys as part of the Tropical Ocean and Global Atmosphere program (TOGA). Since these buoys can detect the eastward spread of warm water months before an El Niño event hits maturity, they serve as an invaluable early-warning tool. (Unfortunately, it’s been a struggle at times to keep the buoys fully funded and maintained. In early 2014, Nature reported that “nearly half of the buoys in the Tropical Atmosphere Ocean array have failed because of delayed maintenance.”)
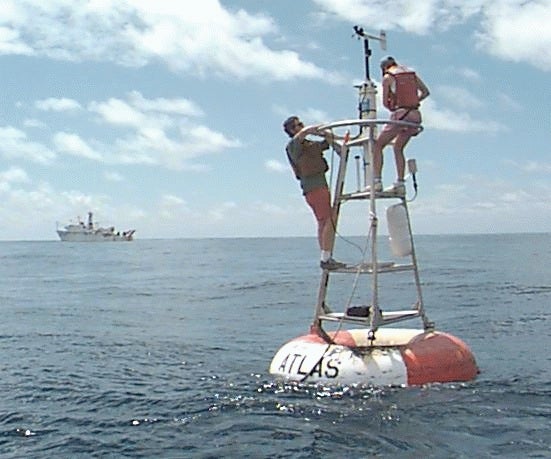
Dozens of instrumented buoys were moored throughout the equatorial Pacific Ocean in the early 1990s, as part of what’s now called the TAO/TRITON array. The array gathers surface meteorological and oceanographic data and records ocean temperature to a depth of about 1,650 feet. (Photo courtesy NOAA.)
Computer models also leapt forward in the 1980s, confirming the ocean-atmosphere linkage and pointing the way toward El Niño forecasts. A regional model developed by Mark Cane and Stephen Zebiak (Lamont-Doherty Earth Observatory) generated some of the first model-based ENSO predictions starting in the late 1980s. Other scientists began to simulate ENSO within global climate models, a task with its own challenges (some of which are still being tackled, as steady progress continues).
TOGA mounted one of the largest-ever atmospheric research projects, the Coupled Ocean-Atmosphere Response Experiment (TOGA COARE). Aircraft and ships canvassed the western Pacific tropics for months, and the resulting analyses showed how tightly the ocean and atmosphere components of ENSO were linked. The study is often cited in research papers to this day.
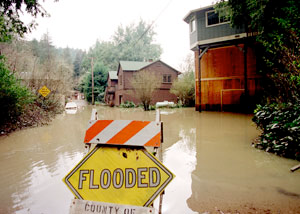
California's Russian River saw damaging floods in March 1998 in the wake of heavy rain associated with that winter's intense El Niño event. (Photo by Dave Gatley, FEMA.)
A massive El Niño, even stronger than the 1982–83 event, took hold in 1997–98. This time, thanks to the TOGA buoy network and more sophisticated satellites, forecasters saw the oceanic precursors well in advance and sounded the alarm ahead of the biggest impacts. These included record rains in California, severe drought in Indonesia, and a deadly tornado outbreak in Florida.
The early warning not only helped decision makers charged with public safety get ready: it also piqued the interest of the public, many of whom hadn’t heard the term El Niño before. That label’s pithiness and catchy flair surely helped. Journalists had a field day with “El Niño,” whereas any headline writer would struggle with “the warm phase of the El Niño–Southern Oscillation.”
This event’s high-water mark in pop culture came on October 25, 1997, as Chris Farley strode onto Saturday Night Live wearing a pro-wrestling outfit and bellowing, “I am El Niño!”
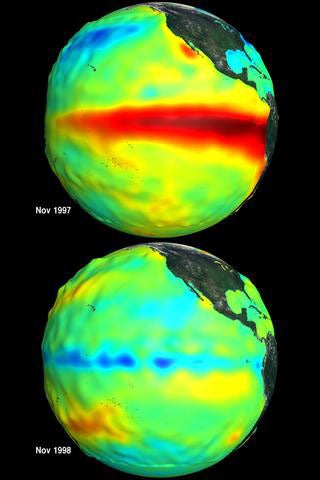
Sea surface temperature and height anomalies in the eastern Pacific Ocean show the influence of expansion and warming during El Niño (November 1997, top) and cooling during La Niña (November 1998, bottom). (Images courtesy NASA.)
In surprisingly short order, the intense El Niño conditions of early 1998 segued into a strong La Niña event (1998–99). Over the preceding years, researchers hadn’t been in total agreement on a name for the cool-water counterpart to El Niño—some had proposed “El Viejo” (the old man”), “anti–El Niño,” or “cold event”—but by 1998, La Niña (“the young girl”) had begun to stick. That summer, NCAR’s Glantz brought a diverse group of scientists, journalists, and policy experts to Boulder for the first-ever La Niña Summit (see PDF for executive summary, United Nations University Press for collected papers).
Thus far, the 21st century has been a quiet century for El Niño. The last 15 years have been more dominated by La Niña events, part of a Pacific-wide rearrangement of ocean circulation that tends to shift modes every 20–30 years. This phenomenon is referred to as the Pacific Decadal Oscillation or the Interdecadal Pacific Oscillation, depending on which part of the ocean is analyzed.
It’s not yet clear what causes the PDO to switch modes from negative (cool sea surface in the central North Pacific) to positive (warm sea surface), or vice versa. But evidence is mounting that the world’s oceans tend to retain more heat deeper down, well below the surface, during the PDO’s negative phase—apparently a big reason why Earth’s atmosphere hasn’t warmed much since the late 1990s.
Today, a number of computer models around the world use current ocean temperatures and atmospheric conditions to project the state of ENSO, looking a year or more into the future. Forecasters examine multi-model ensembles, scrutinizing where various models agree or disagree, in order to issue El Niño and La Niña forecasts. Among the leading sources of regular ENSO forecasts are NOAA’s Climate Prediction Center, the International Research Institute for Climate and Society at Columbia University, and the Australian Bureau of Meteorology. (Note that the Australian BOM uses a higher threshold for El Niño development than the U.S. definition.)
El Niño hype returned in a big way early in 2014, when a huge surge of warm water spread eastward across the tropical Pacific. Some computer models suggested that a major El Niño event could develop by later in the year. But by the autumn of 2014, El Niño hadn’t yet materialized, a no-show that was widely interpreted as a forecast “bust.” Only in November did the signs of an approaching El Niño become more insistent, with sea surface temperatures in the Pacific’s Niño3.4 measurement region finally pushing well above the threshold of 0.5°C above average.
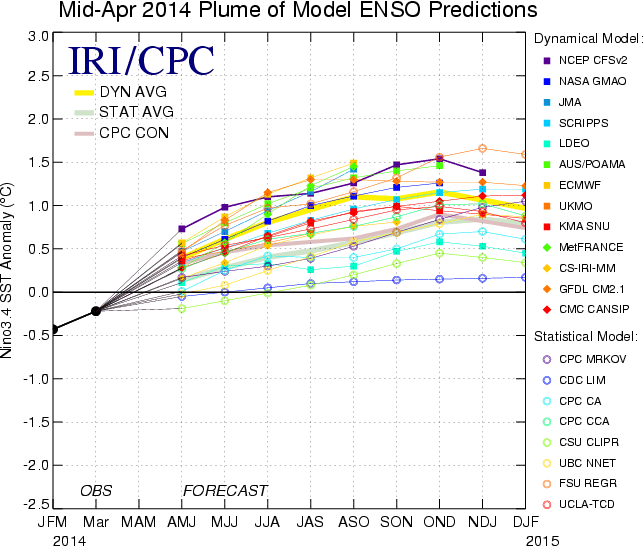
Was the forecast really so bad? Northern spring is a notoriously difficult time to predict ENSO evolution. Moreover, the models and forecasters were never in lockstep agreement about what would happen later in 2014. The model consensus posted by the International Research Institute in April (in partnership with NOAA) wasn’t particularly dire, though some models did end up overshooting the mark. As conditions and model solutions evolved, NOAA's predicted likelihood that an El Niño would form by summer 2014 rose from 50% in the March outlook (PDF) to "exceeding 50%" in April (PDF), 65% in May (PDF), and 80% in June (PDF), with that June forecast applying to fall/winter 2014–15 rather than summer 2014.
Update: December 2, 2014 | The above paragraph has been revised to incorporate a fuller range of NOAA products issued in early 2014.
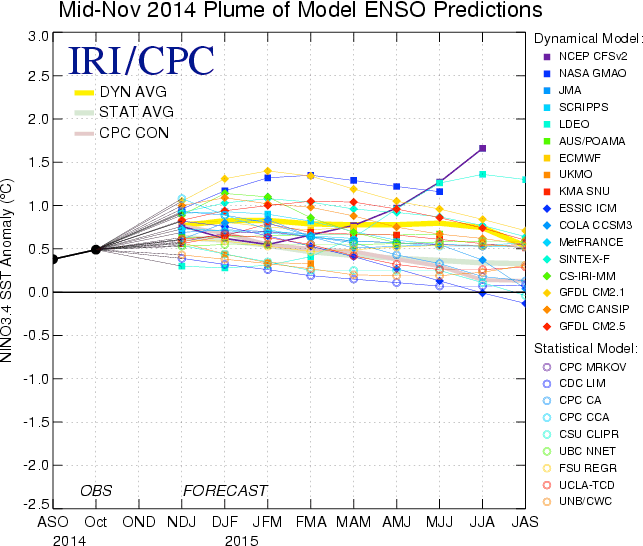
As of mid-November 2014, the various prediction models examined by the International Research Institute for Climate and Society (IRI) tended to produce a weak to moderate El Niño for winter 2014-15, but with a fair bit of spread among the model solutions. (Image courtesy IRI.)
The “missing” El Niño event of mid-2014 reminds tells us that we need to carefully manage our expectations about El Niño prediction. Once the oceanic and atmospheric fingerprints of El Niño begin to take shape in northern fall, as they're doing right now, then we can look more confidently to the impacts likely to occur the following winter, when El Niño events typically peak. However, this isn’t really predicting El Niño itself so much as “nowcasting” the emergence of El Niño’s oceanic warming and predicting the resulting impacts we’re likely to see.
The oceanic shift itself remains much more difficult to forecast. The dance between atmosphere and ocean that nurtures and sustains El Niño is simply too complex for any model to capture with total accuracy. That’s why it’s so important to keep probabilities in mind. We can’t expect ironclad certainty on whether or when the eastern Pacific will warm into an El Niño event, but we can use multiple models to help gauge the odds.
Similarly, and crucially, since each El Niño is different and since other weather and climate variables are always in the mix, the presence of El Niño doesn’t guarantee that Los Angeles will be doused with midwinter rain or Seattle will be dry and mild. However, it does shift the likelihoods in those directions.
In that sense, we might want to think of El Niño less like an appealing buffoon from a comedy sketch—and more like a shrewd oddsmaker from a densely plotted thriller.
El Niño, La Niña & ENSO FAQ (NCAR/UCAR Backgrounder, December 2014)
The "Almost" El Niño of 2014 (UCARConnect, December 2014)
Writer/contact:
Bob Henson, NCAR/UCAR Communications