El Niño, La Niña & ENSO FAQ
Background on these key players in year-to-year weather and climate variation
Dec 2, 2014 - by Staff
Temporary impacts to NSF NCAR Road, Parking Lot and Trails
View more information.Dec 2, 2014 - by Staff
![]()
What is El Niño?
What is La Niña?
What is ENSO and what does it stand for?
How did these terms originate?
How are El Niño and La Niña events defined?
How do El Niño and La Niña affect weather in other parts of the world?
Do El Niño and La Niña influence global temperature?
Will climate change influence El Niño and La Niña?
Advances in ENSO research
Predicting El Niño and La Niña events
What forces cause an El Niño to develop?
Related stories
Here comes El Niño—but what exactly is it?
El Niño or La Nada? The great forecast challenge of 2014
¡Hola, La Nada! What happens when El Niño and La Niña take a break?
![]()
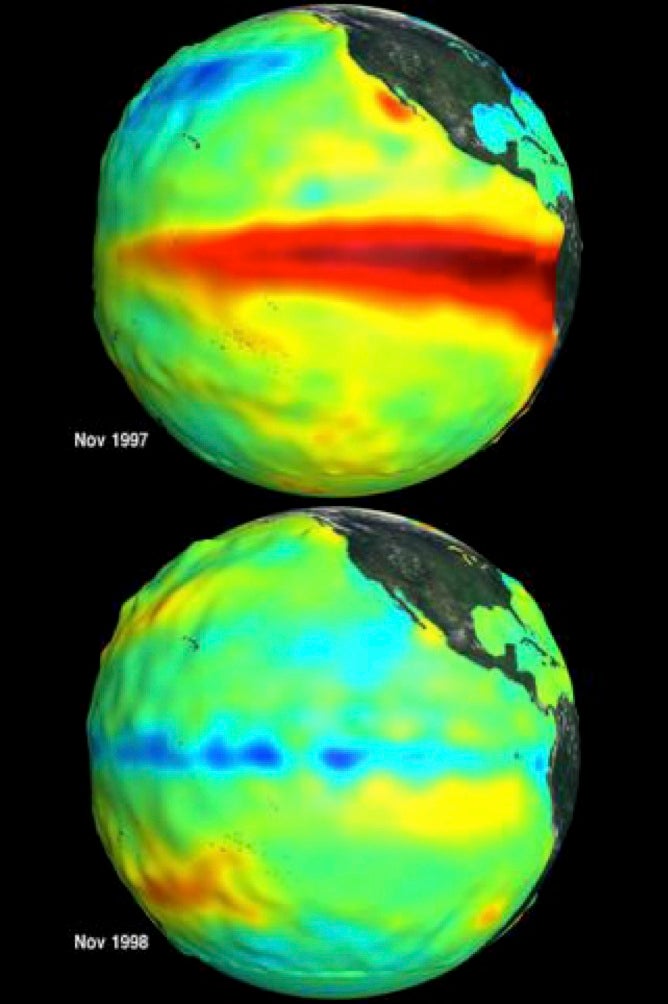
Sea surface temperature and height anomalies in the eastern Pacific Ocean show the influence of expansion and warming during El Niño (November 1997, top) and cooling during La Niña (November 1998, bottom). (Images courtesy NASA.)
El Niño is a warming of the central to eastern tropical Pacific that occurs every two to seven years, on average. The term also commonly refers to the atmospheric rearrangements that occur with the oceanic warming. During an El Niño event, sea surface temperatures across a watery expanse often as large as the United States can warm by 1–3°F or more for a period of from a few months to a year or two.
La Niña, the counterpart to El Niño, is a cooling of the waters across the same region. As with El Niño, the term La Niña typically is used to refer to the associated atmospheric as well as oceanic patterns. It often lasts longer than El Niño, sometimes persisting or recurring for two or more years.
El Niño and La Niña are normally accompanied by variations in the tropical Pacific Ocean’s Walker Circulation (see diagram), as well as a vast see-saw in atmospheric pressure—the Southern Oscillation—that modifies the Walker pattern. The term El Niño–Southern Oscillation, or ENSO, refers to the combination of atmospheric and oceanic effects associated with both El Niño and La Niña.
El Niño and La Niña can be thought of as the ocean part of ENSO, while the Southern Oscillation can be thought of as the atmospheric component. Through the atmosphere, teleconnections occur via waves to influence regions far from the tropical Pacific (see below).
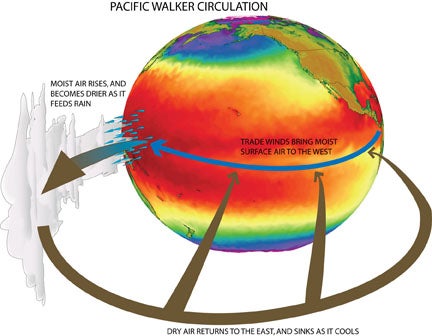
This diagram shows the Walker Circulation, a vast loop of air above the equatorial Pacific Ocean. See below for an alternate depiction. Click here or on the image to enlarge. (Illustration by Gabriel Vecchi, UCAR.)
ENSO is a coupled phenomenon that would not occur without interactions between the atmosphere and ocean. Sometimes an atmospheric shift can occur in the tropical Pacific without the ocean fully responding, or vice versa. However, for an El Niño or La Niña to develop, the atmosphere and ocean must evolve in sync. For example, the usual east-to-west surface trade winds across the tropical Pacific (see diagram at left) tend to weaken during El Niño; this allows warm water to shift toward the eastern tropical Pacific. That warm water supports the eastward development of showers and thunderstorms, and the resulting atmospheric circulations tend to weaken the trade winds even further. Such positive feedbacks are crucial for the development of both El Niño and La Niña events.
ENSO is one of the main sources of year-to-year variability in weather and climate around the world. Research to more fully incorporate this interannual variability into computer models is a major focus for improving long-range forecasting.
The name El Niño originated in the region where one of the phenomenon’s local effects was first recognized. Fishing people and other coastal residents of Peru had long noticed a strange feature in the eastern Pacific Ocean waters that border their home. This region of tropical yet relatively cool water is host to one of the world’s most productive fisheries and a large bird population. In the first months of each year, a warm southward current usually modified the cool waters. But every few years, this warming started early (in December), was far stronger, and lasted as long as a year or two. Torrential rains fell on the arid land; as one early observer put it, “the desert becomes a garden.” Warm waters flowing south brought water snakes, bananas, and coconuts from equatorial rain forests. However, the same current shut off the deeper, cooler waters that are crucial to sustaining the region’s marine life.
Because these strong events were often observed close to Christmas time, the phenomenon was dubbed El Niño (when capitalized, “the little boy” becomes “the Christ Child” in Spanish). Although “la niña” refers to a young girl, the capitalized term La Niña did not originate in the same way; it was adopted by researchers in the 1970s and 1980s to illustrate the relationship between warming and cooling events in the waters of the eastern tropical Pacific. Some researchers suggested “El Viejo” (the old man) or “anti–El Niño” as alternatives, but La Niña has won out as the standard term.
The most widely used definitions of El Niño and La Niña involve sea surface temperatures (SSTs) across the eastern tropical Pacific (see map below). To qualify as an El Niño event, according to the definition used by the National Oceanic and Atmospheric Administration, SSTs must remain at or above 0.5°C (about 1°F) for at least three months across the region labeled Niño3.4. NOAA provides historical records for temperatures in this key region. A “moderate” event would see readings holding at or above 1.0°C, and a “strong” event would be 1.5°C or higher. Sometimes the term “El Niño conditions” is used when SST readings have hit the El Niño threshold but haven’t been in place long enough to qualify as an El Niño event.
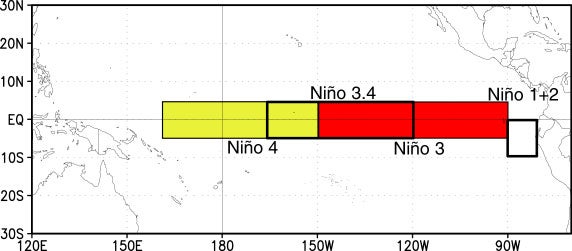
Sea-surface temperature, averaged across the regions above, is used to track and diagnose El Niño and La Niña conditions. The Niño3.4 region is most commonly used. For reference, the vertical line at 180 degrees longitude represents the International Date Line. (Image courtesy Jan Null, Golden Gate Weather Services.)
The Australian Bureau of Meteorology uses a Niño3.4 SST threshold of 0.8°C rather than 0.5°C to define El Niño, because a greater amount of SST warming is needed to produce impacts in Australia.
The definitions for La Niña are the same as those for El Niño, except that the sea surface temperatures are below average rather than above.
Each region highlighted in the map can be used to convey the nature of a particular event. Some El Niños show warming focused in the far eastern Pacific (Niño1+2). Others show the greatest oceanic warming across the Niño4 region, with substantially different atmospheric patterns than other El Niño events. This latter type is referred to as “El Niño Modoki” (from the Japanese for “similar but different”).
Both El Niño and La Niña are most likely to intensify during northern fall, peak during the winter, and subside in the spring. For this reason, El Niño and La Niña events are often referred to by two adjoining calendar years (e.g., 2005–06).
This graphic shows three-month running averages of sea-surface temperature across the Niño3.4 region. (Graph courtesy NOAA.)
The strongest El Niño events on record, in 1982–83 and 1997–98, had three-month Niño3.4 averages peaking at 2.2°C and 2.4°C, respectively, according to NOAA’s Oceanic Niño Index table.
The strongest La Niña event was in 1973–74, with a three-month Niño3.4 average reaching –2.0°C. An especially prolonged La Niña ran from mid-1998 to early 2001, with the index dipping to –1.7°C.
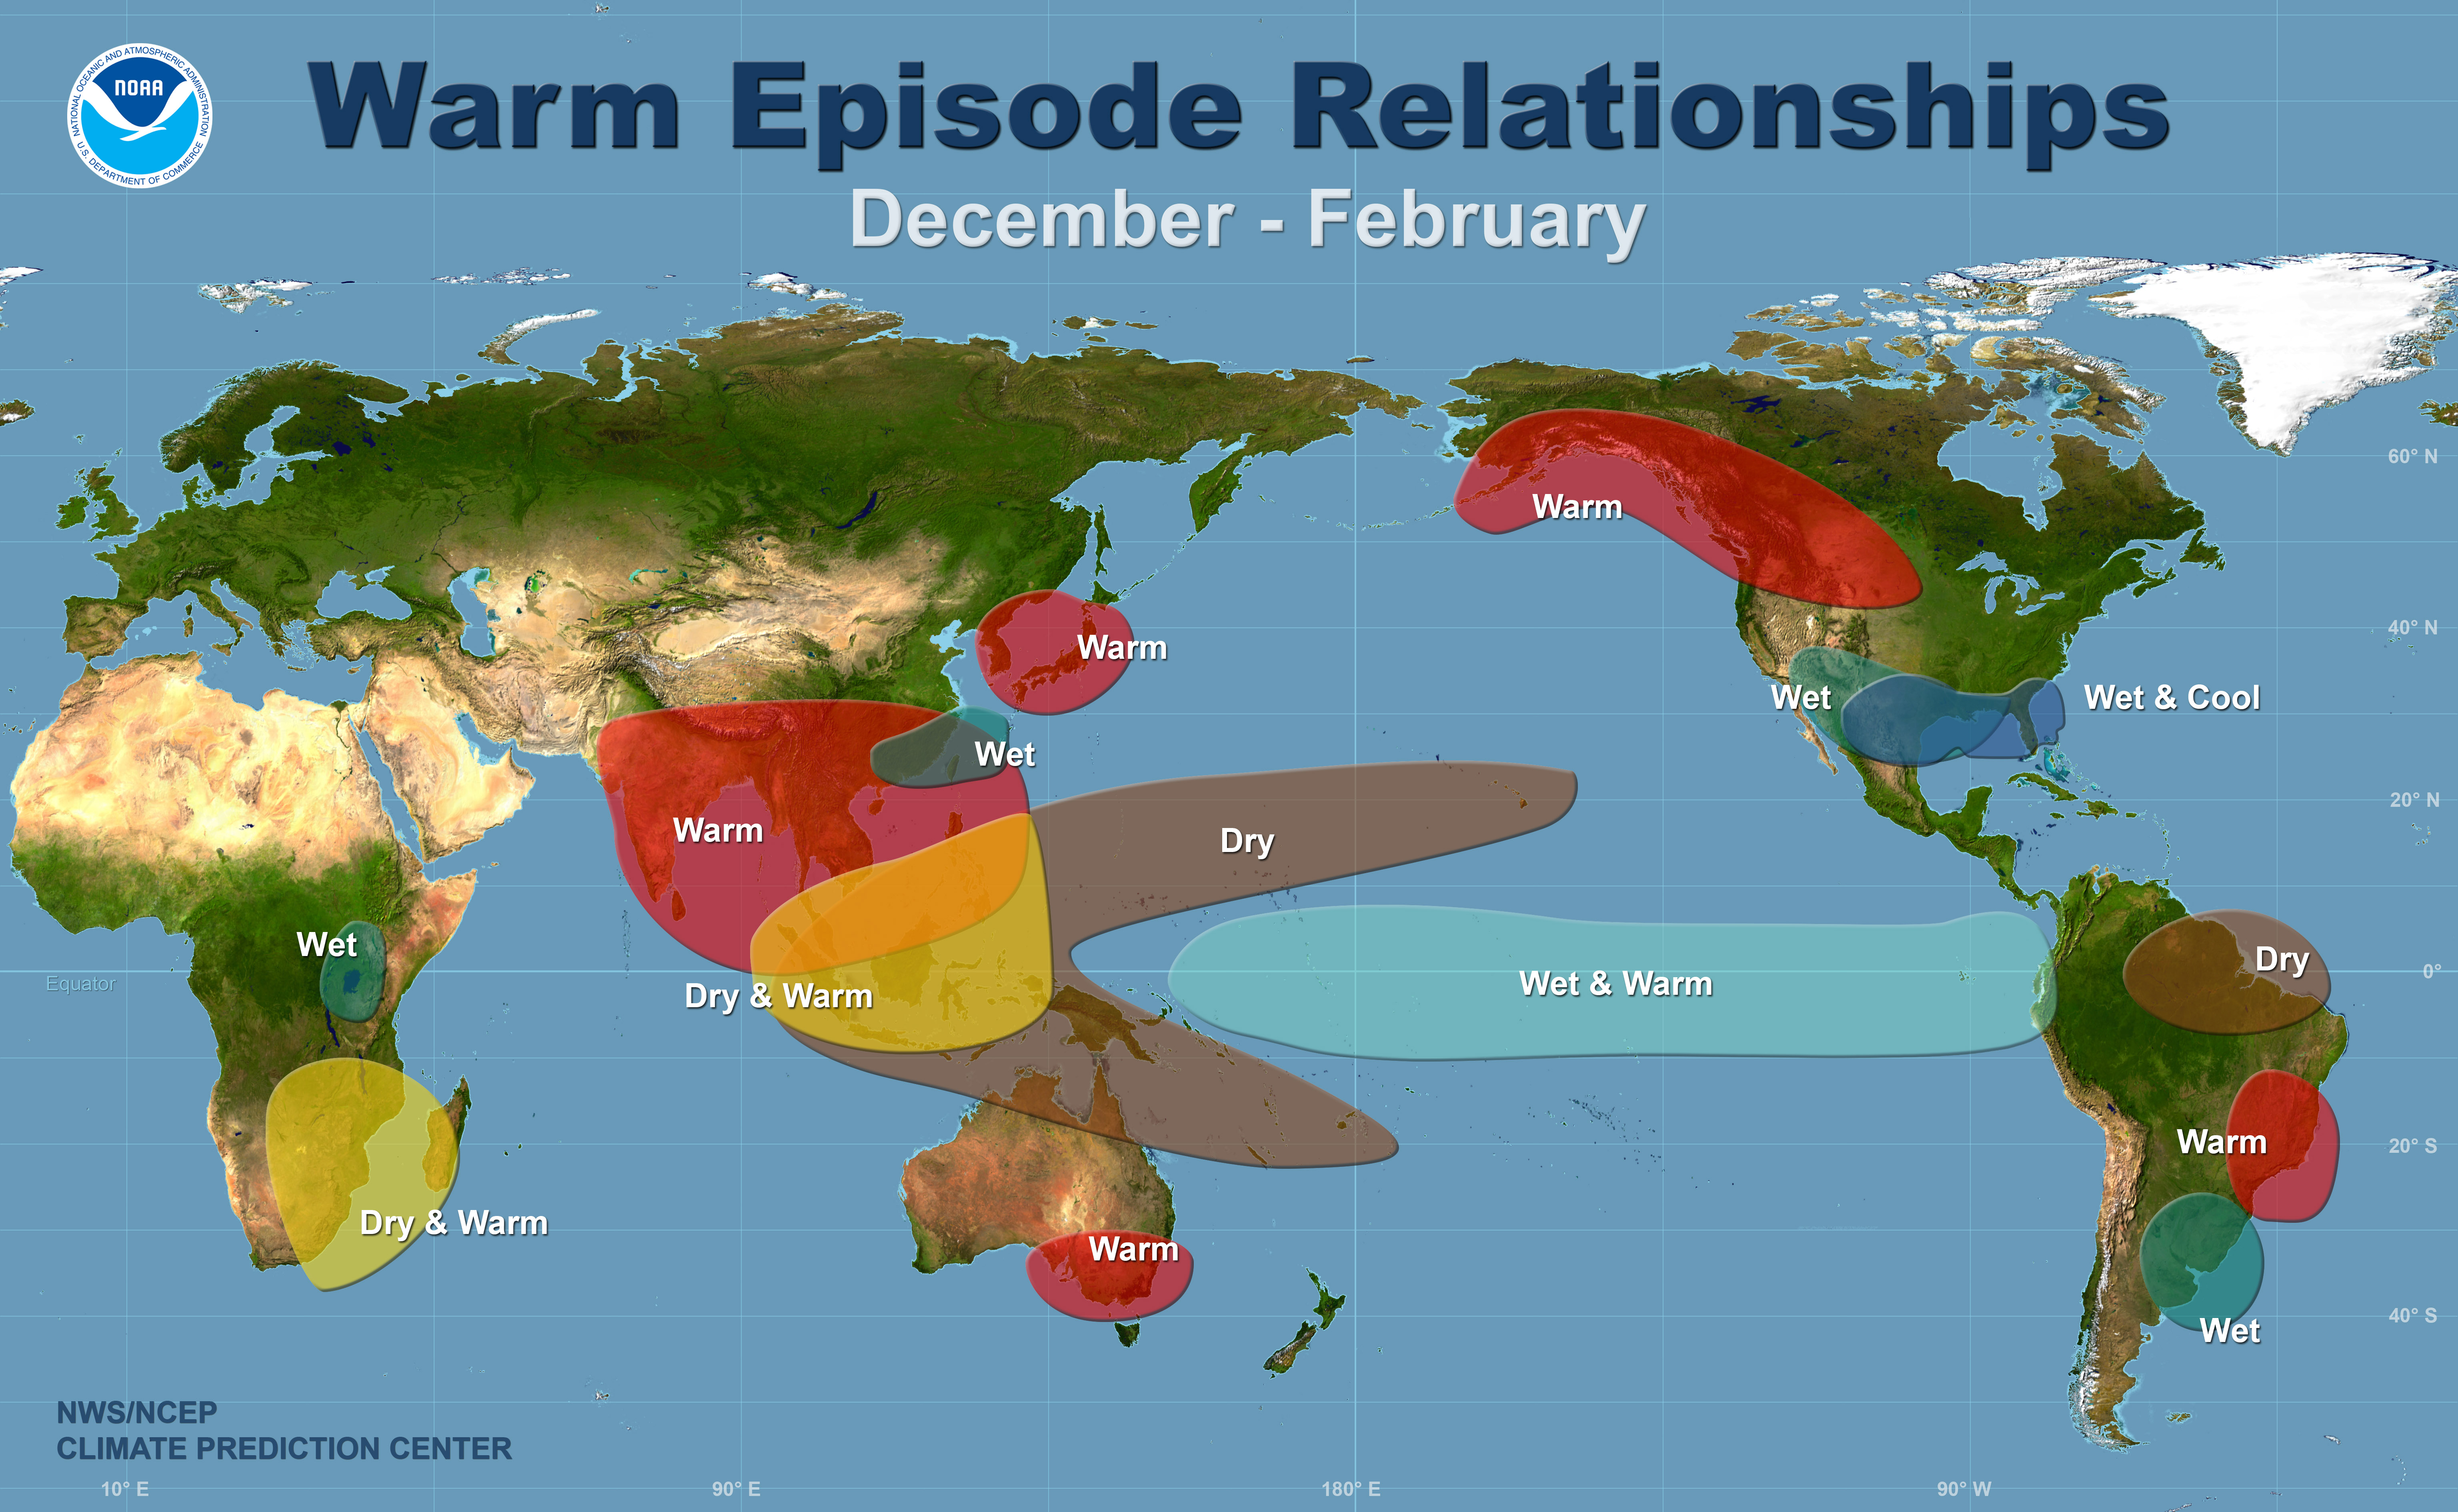
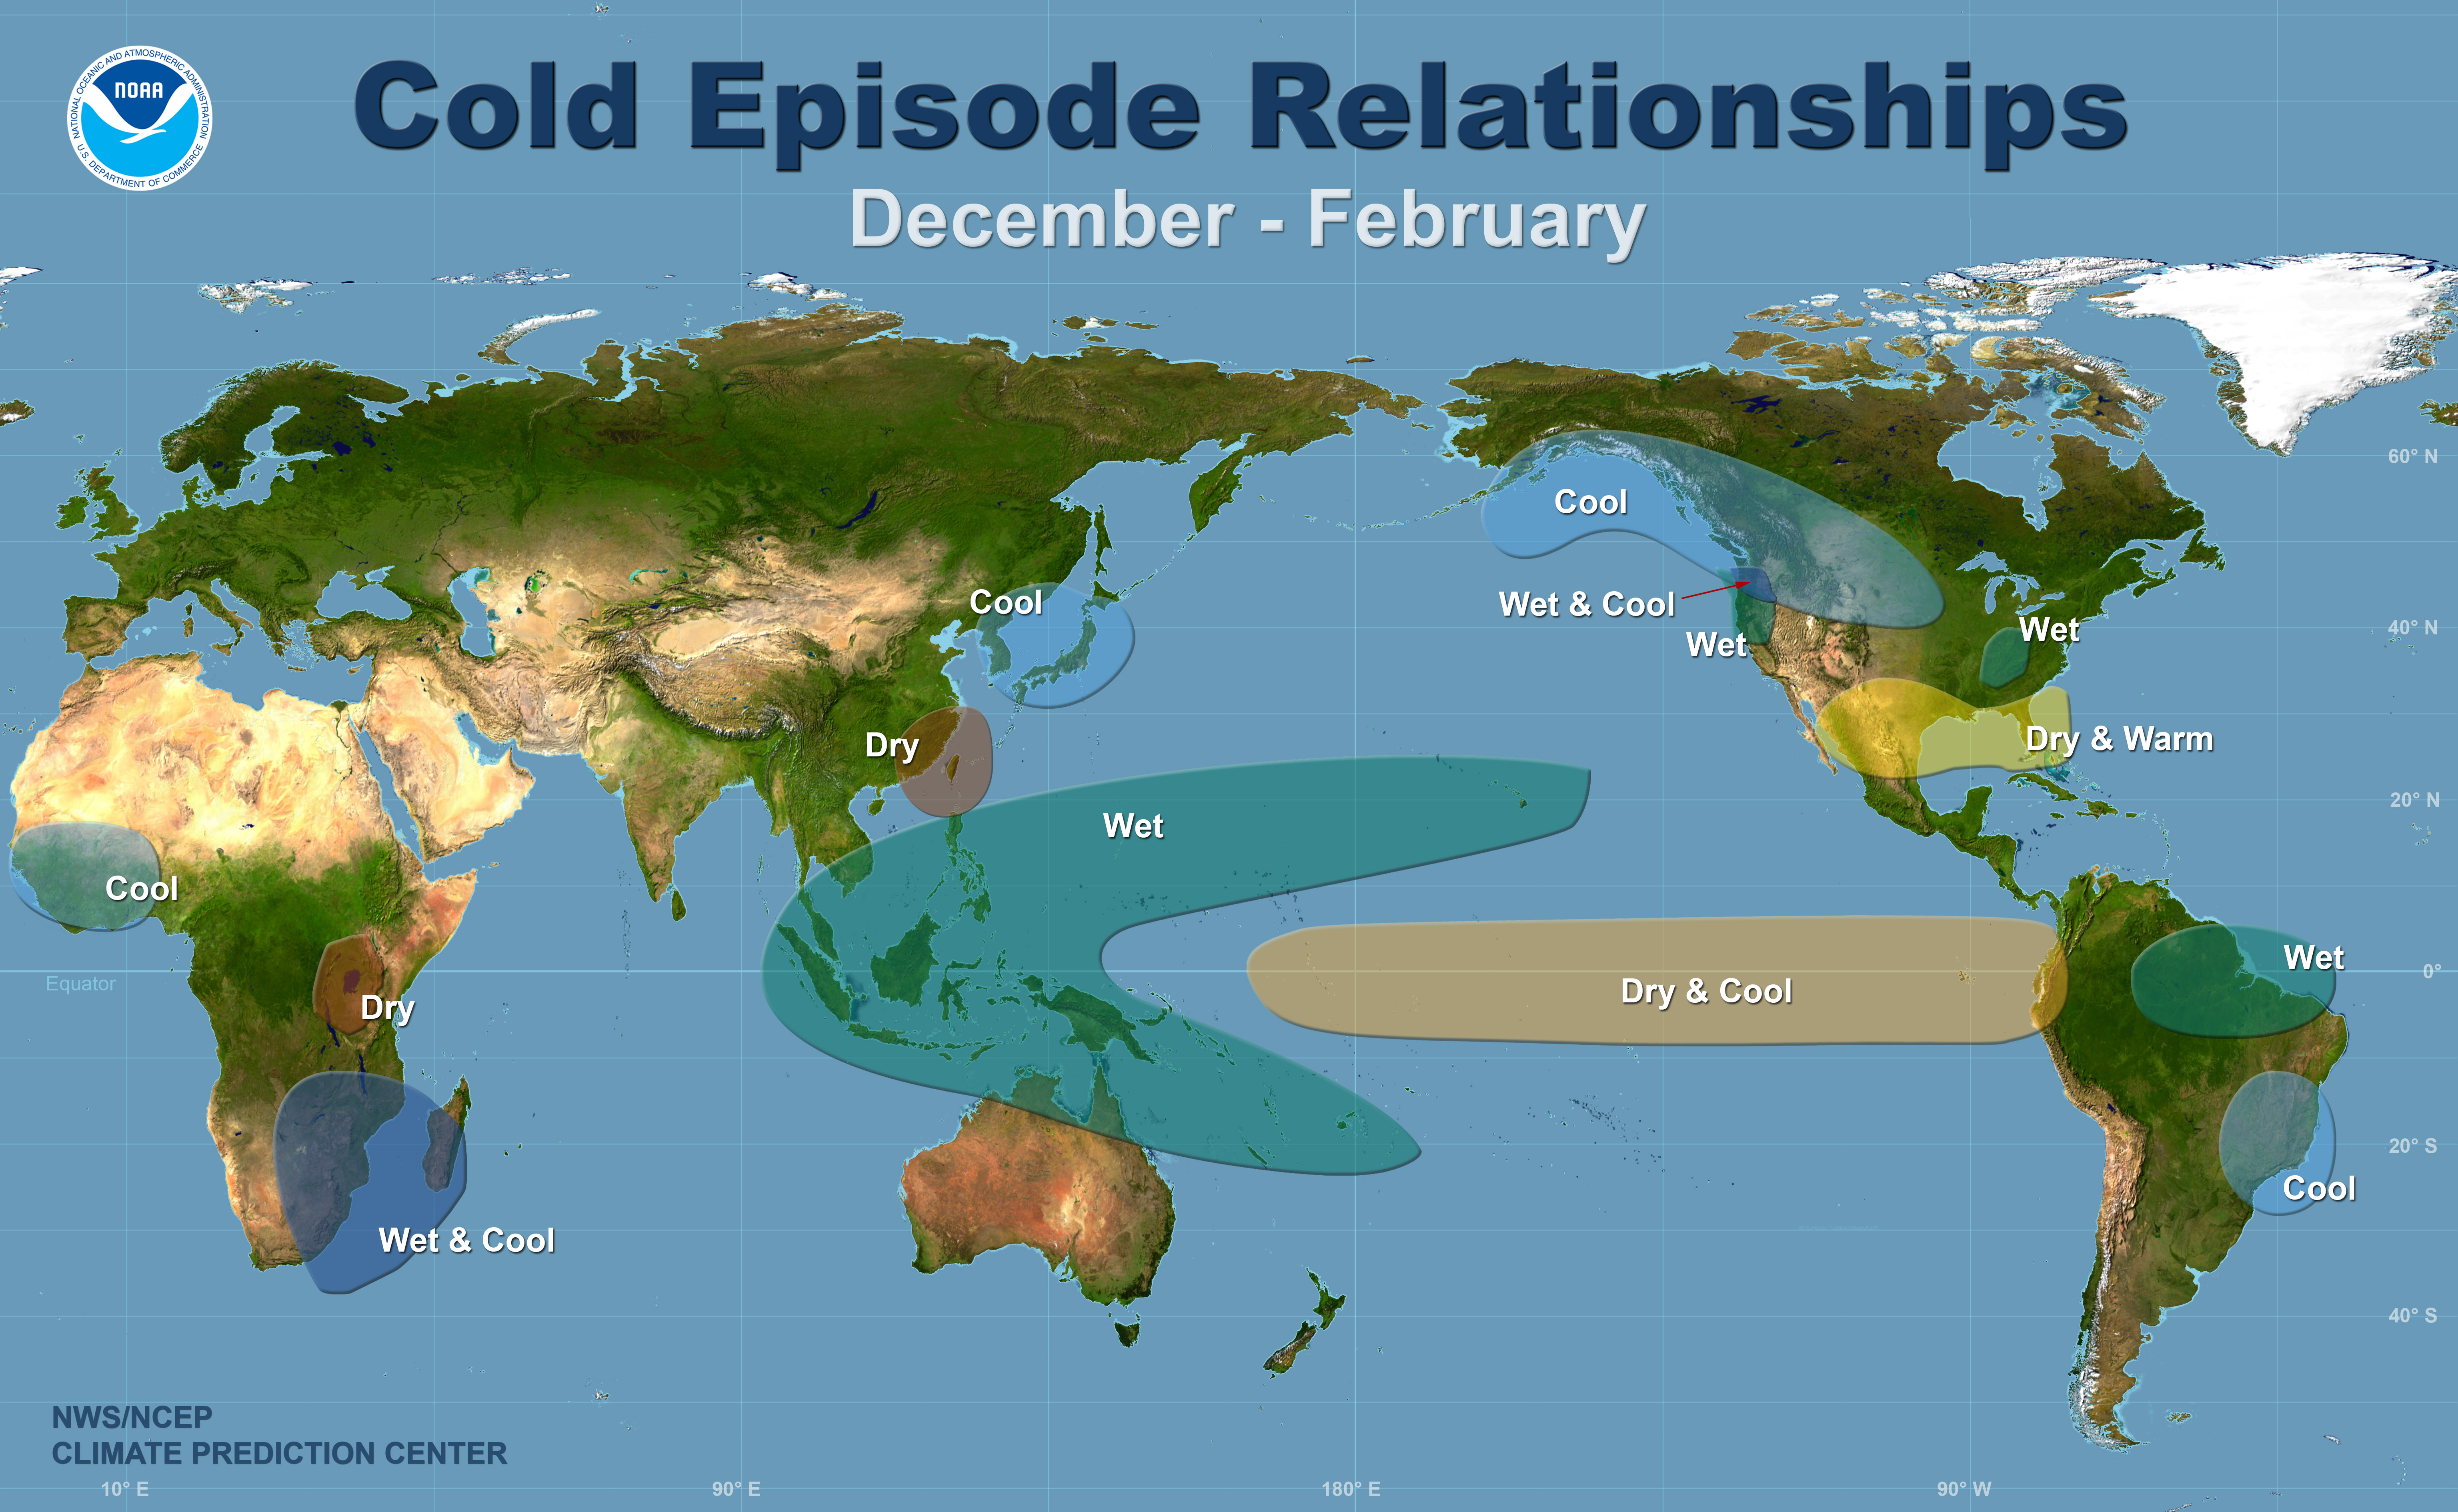
During an El Niño event, as warm surface water in the Pacific is shifted thousands of miles east of its usual location, the showers and thunderstorms nurtured by convection above this warm tropical water also change location. As the rising motion associated with the convection also shifts eastward, it causes other adjustments in atmospheric circulation, well away from the tropical Pacific. These persistent zones of rising and sinking air can shift into new locations for months, causing prolonged wet or dry conditions and related atmospheric heating anomalies. In turn, the anomalous heating sets up planetary-scale waves in the atmosphere that radiate away from the region, especially into the hemisphere experiencing winter. These are “teleconnections”—large-scale, long-lasting shifts in atmospheric circulation that can affect much of the globe. The effects extend throughout the Pacific Rim, across large parts of North America, and on to eastern Africa and other regions. La Niña brings a different set of teleconnections to these and other regions, with some but not all effects roughly opposite to those of El Niño.
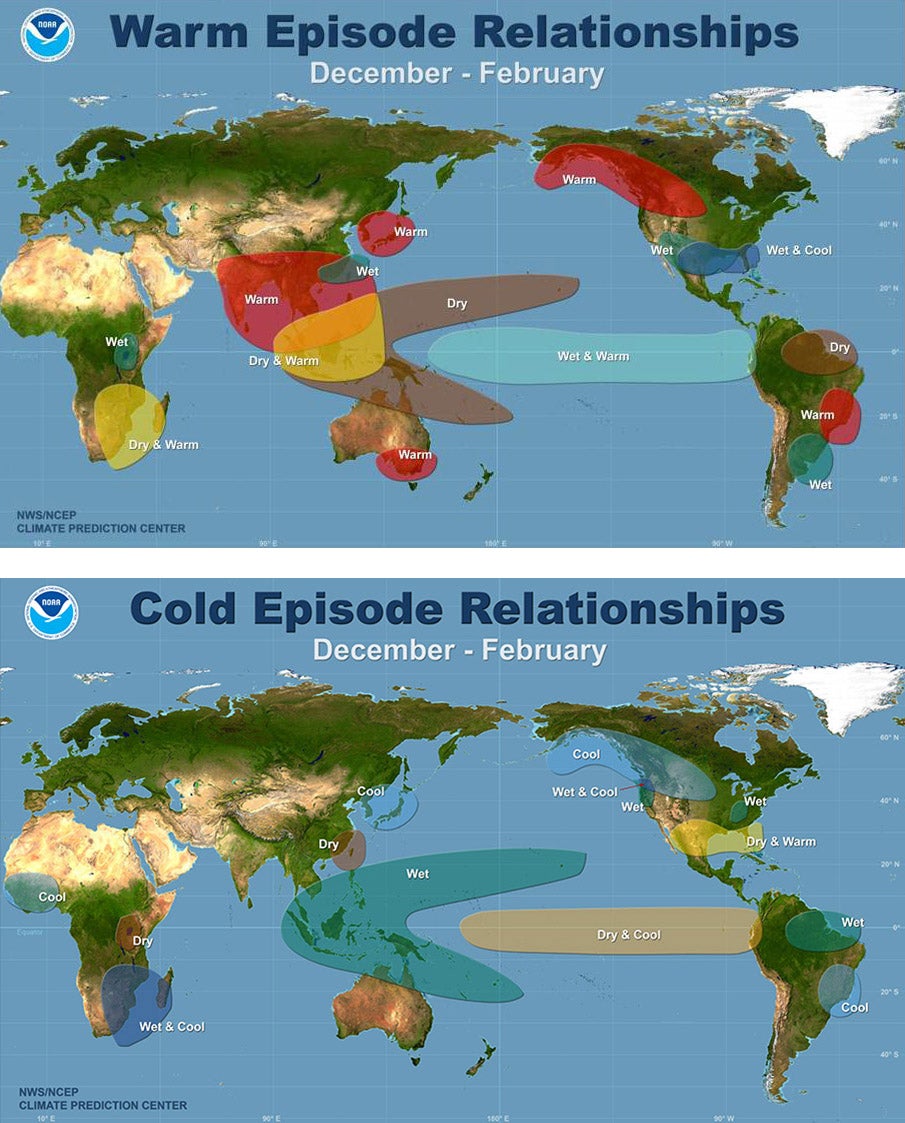
These maps show the most commonly experienced impacts related to El Niño (“warm episode,” top) and La Niña (“cold episode,” bottom) during the period December to February, when both phenomena tend to be at their strongest. (El Niño and La Niña images courtesy NWS/NCEP Climate Prediction Center.)
The maps at right show the most common teleconnections associated with El Niño and La Niña during northern summer and winter. Not every warm- or cool-water event will produce all of these impacts, because other atmospheric features interact with each ENSO event to influence weather and climate around the globe. Weaker events, in particular, may look quite different from the prototypes shown here. El Niño Modoki events (where the warming is concentrated further to the west than usual) show significant differences in teleconnections from other El Niño events.
In the United States, a strong El Niño event tends to produce milder- and drier-than-average conditions toward the north and cooler- and wetter-than-average conditions to the south. In California, a strong El Niño very often brings more moisture than usual. However, during the weakest El Niño events, San Francisco and Los Angeles are a bit more likely to be unusually dry than unusually wet. (Meteorologist Jan Null maintains a compilation of additional El Niño “myths and realities.”)
During El Niño, a deep pool of warm water usually restricted to the western tropical Pacific is replaced by a much larger, more shallow pool of warm water that covers most or all of the tropical Pacific. The expanded zone of warm sea surface temperatures allows more heat to be conveyed from the ocean into the atmosphere for months at a time. As a result, globally averaged temperatures often rise by a few tenths of a degree Fahrenheit during the latter stages of a strong El Niño event. Conversely, global temperatures can drop by a similar amount during a La Niña event.
NCAR scientist Kevin Trenberth has likened El Niño to a “pressure valve” that releases built-up heat from the oceans into the atmosphere. The oceans cool during El Niño events, while the global atmosphere warms.
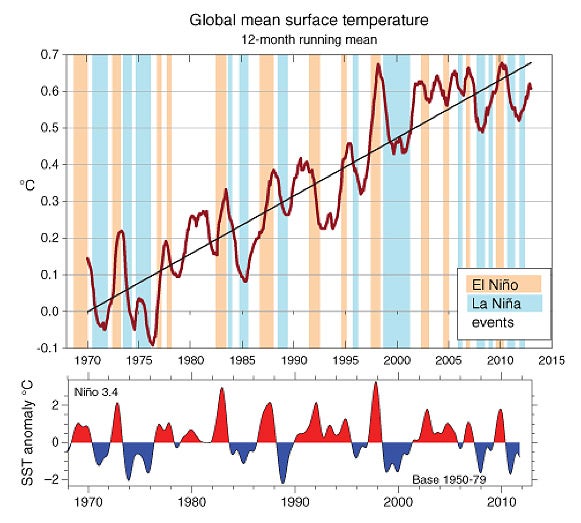
The red line above shows surface temperatures (over land and ocean), in a running 12-month average, as calculated by NOAA. The vertical, shaded bars indicate El Niño (buff) and La Niña (sky blue) periods, based on Niño3.4 SST (sea surface temperature) anomalies. These anomalies appear in red (warm) and blue (cool) in the lower panel. (Figure 6, “An apparent hiatus in global warming?” Kevin E. Trenberth and John T. Fasullo, Earth’s Future, 2013.)
Scientists often account for ENSO by factoring out these bumps and dips in global temperature when analyzing the long-term trends related to climate change. For example, the first 15 years of this century saw more La Niña than El Niño influence, and global air temperatures showed little rise. Prior to that period, in the 1980s and 1990s, when El Niño events were more frequent, global temperatures rose more sharply.
The map at right shows year-to-year fluctuations in global temperature (in red), the long-term trend of rising global temperature (in black), and the starts and stops of all ENSO events (shaded vertical bars). Note that other factors also influence global temperature, such as the eruption of Mt. Pinatubo in 1991. The volcano threw enough sun-blocking material into the atmosphere to cause a drop in global temperatures during 1992, despite the presence of El Niño.
Shifts in global temperature, as well as in the likelihood of ENSO events, are closely associated with the state of the Pacific Decadal Oscillation (PDO), a pattern of ocean temperatures that reverses every 20-30 years. More La Niña events tend to be observed when the PDO is negative, and more El Niño events when it is positive. Scientists are not yet sure what prompts the PDO to shift modes.
Despite steady improvement, it remains difficult for many global climate models to simulate all aspects of ENSO events, so it has been a challenge to determine whether or how El Niño and La Niña will be affected by rising global temperatures. Some models have suggested that the central Pacific could warm enough to produce El Niño–like conditions on a semipermanent basis. The most recent (2013) assessment by the Intergovernmental Panel on Climate Change concluded:
There is high confidence that the El Niño-Southern Oscillation (ENSO) will remain the dominant mode of interannual variability in the tropical Pacific, with global effects in the 21st century. Due to the increase in moisture availability, ENSO-related precipitation variability on regional scales will likely intensify. Natural variations of the amplitude and spatial pattern of ENSO are large and thus confidence in any specific projected change in ENSO and related regional phenomena for the 21st century remains low. [See IPCC AR5, Working Group I, PDF, page 21]
Since recognizing more than 40 years ago that the oceanic and atmospheric parts of ENSO are strongly linked, scientists have investigated the combined phenomena from a variety of perspectives, gradually building a deeper understanding of this complex, influential atmospheric pattern.
When a major El Niño event struck without warning in 1982–83, scientists recognized the event only after it had formed. This was because of limited observations, primitive computer models, the presence of simultaneous effects from a 1982 eruption of Mexico’s El Chichón, and an incomplete recognition of how El Niño development could vary from one event to another.
Over the following decade, the United States, Japan, and other nations deployed instrumented buoys across much of the tropical Pacific. Since these buoys can detect the eastward spread of warm water months before an El Niño hits maturity, they serve as an invaluable early-warning tool.
A regional model developed at Lamont-Doherty Earth Observatory generated some of the first model-based ENSO predictions starting in the late 1980s. Today, a number of computer models around the world use current ocean temperatures and atmospheric conditions to project the state of ENSO, looking a year or more into the future. Forecasters examine multi-model ensembles, scrutinizing where various models agree or disagree, in order to issue El Niño and La Niña forecasts.
This graphic shows the likelihood of El Niño (red vertical bars), La Niña (blue bars), or neutral conditions (green bars) for overlapping three-month periods starting with November 2014–February 2015 (NDJ), with the likelihoods determined by a consensus of experts based on input from multiple computer models. The thin horizontal lines show the likelihood derived from climatology alone (the average occurrence, based on past experience). (Image courtesy International Research Institute for Climate and Society.)
Among the leading sources of regular ENSO forecasts are NOAA’s Climate Prediction Center, the International Research Institute for Climate and Society at Columbia University (working with NOAA), and the Australian Bureau of Meteorology. (Note that the Australian BOM uses a higher threshold for El Niño development than the U.S. definition; see above.)
Generally, the strongest ENSO events are predicted more accurately than weaker ones. A 2012 analysis in the Bulletin of the American Meteorological Society evaluated ENSO forecasts from 20 different prediction models for the period 2002 to 2011. The study found that the predictive skill of these models actually declined in the 2000s as compared to the 1980s and 1990s—not because of any loss in model quality (the models themselves had actually improved), but because the weaker, more variable ENSO events in this period made forecasting a far greater challenge.
For more about the history of ENSO research, see Here comes El Niño—but what exactly is it?
To figure out if a strong El Niño is on the way, forecasters must analyze a series of complex events and processes, ranging from the shifting temperature and structure of subsurface waters across the Pacific, to the evolution of trade winds as well as more localized wind bursts.
The most intense Kelvin wave ever recorded across the equatorial Pacific Ocean brought a huge area of warmer-than-average water eastward from April to July 2014, but it failed to produce the long-lasting warm surface waters that define an El Niño event. These monthly cross sections show where water temperatures are departing from average within a slice of the equatorial Pacific, with Indonesia on the left and South America on the right. The legend at right is in multiples of 0.5°C. (Image courtesy Australian Bureau of Meteorology.)
One ingredient that appears to be crucial is a multiyear buildup of warm water in the western Pacific. Two types of slow-moving disturbances can also push water upward and downward across the Pacific. Rossby waves travel westward, while Kelvin waves move eastward. In both cases, the sea surface rises, then falls, by up to several inches over a period of weeks to months as the wave passes. Often these effects are transient, but sometimes they can help nudge the Pacific into or out of an El Niño pattern. So can the Madden-Julian Oscillation, a pulse of atmospheric energy generated in the Indian Ocean every few weeks. MJO events can push clusters of showers and thunderstorms eastward across the tropical Pacific.
In addition, to get an El Niño going, something must slow or reverse the trade winds. Once that happens, the displaced wind and water can then reinforce the El Niño state in a feedback process lasting for months. However, it’s not easy to turn around those persistent east-to-west winds in the first place. Westerly wind bursts can help do the trick. These clumps of west-to-east wind, pushing directly against the trade winds, can span hundreds of miles and can last a few days to several weeks. They can also kick off the Kelvin waves noted above.
Although La Niña can develop independently of El Niño, it often materializes immediately after an El Niño event, as Kelvin waves and other phenomena cause the ocean to “bounce back,” overcorrecting the changes initially brought by El Niño. The La Niña pattern involves a strengthening rather than a partial reversal of both trade winds and the larger Walker Circulation. In part because La Niña more closely resembles the neutral state of the Pacific, it is somewhat easier for a La Niña event to last longer (up to 2–3 years) than an El Niño, which rarely persists for more than a year at a time.
Scientific adviser: Kevin Trenberth
Writer: Bob Henson
Last updated : December 2014