The birds and the boundary layer
Jan 27, 2010 - by Staff
Temporary impacts to NSF NCAR Road, Parking Lot and Trails
View more information.Jan 27, 2010 - by Staff
Margaret LeMone | 27 January 2010 • I love to watch birds. I’m watching birds on the feeder outside the window as I’m writing this. Mostly my watching is limited to seeing which ones show up at our bird feeders, and when; but I also like to see how the weather influences their behavior. On sunny days, the birds seem to feed earlier than on cloudy days. And on snowy days like this one, it seems like traffic is higher.
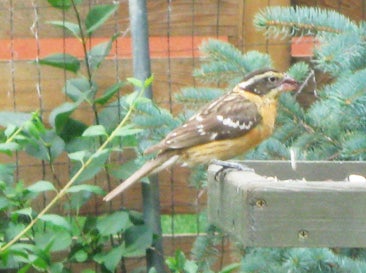 Figure 1. Black-headed grosbeak on our platform feeder.
Birds spend a great deal of time in the atmospheric boundary layer—the region directly affected by surface friction and the heating and cooling of the surface. In midlatitudes this layer is typically a few hundred meters deep, but depending on location and season, it can be much deeper or much more shallow. During a clear day, it is the boundary layer that feels “bumpy” when we take off or land in an aircraft. The bumpiness is due to warm, buoyant air currents (convective plumes) rising from the ground, as well as changes in wind speed or direction.
Some great studies have used observations of birds to examine the atmospheric boundary layer. One of the most well-known papers of this kind is “Soaring over the Open Sea,” by Alfred Woodcock, published in Scientific Monthly in 1942. When I was a graduate student studying the structure of boundary-layer convection using tower and aircraft data, I was awed by this paper, for Woodcock was able to determine how the structure of boundary-layer convection changes with wind speed simply by observing changes in the soaring behavior of herring gulls.
What did Woodcock see, and what did he conclude from it?
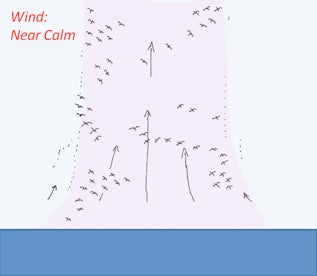 Figure 2. Sketch of gulls soaring in a thermal at low wind speeds. The pink shading denotes the area with vertical velocities strong enough to support the gulls. The heights of the soaring gulls in Woodcock’s study were between about 100–300 feet and 2,000 feet (30–60 meters and 600 meters). (Figures 2 and 3 are adapted from a 1942 paper by Alfred Woodcock in Scientific Monthly, “Soaring over the Open Sea,” pp. 226–252.)
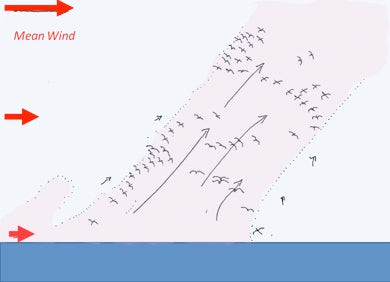 Figure 3. As in Figure 2, but for gulls soaring in a plume with stronger winds. In his original illustration, Woodcock shows the tilt decreasing slightly with height.
Many years later, several of us observed the same basic phenomena as Woodcock—in our lingo, we studied the dependence of boundary-layer convective structure on wind speed and surface buoyancy flux (which reflects surface-atmosphere temperature difference). But instead of herring gulls, we drew our data from aircraft, tall towers, radars, lidars, satellite images, and large-eddy simulations (computer models designed to simulate boundary-layer motions).
Woodcock was able to observe the thermals themselves by watching groups of gulls soaring at different heights. He concluded that plumes were nearly vertical in light winds (Figure 2), but that they were tilted in strong winds (Figure 3).
Getting to the root of thermals
Woodcock envisioned plumes as being vertically continuous, but others proposed air rising in bubbles, much as the bubbles rise from the bottom of the pan in boiling water. In fact, in the 1970s, it was commonly thought that cumulus clouds over the tropical oceans didn’t even have “roots.” Rather, they were believed to draw (or sip?) water vapor from the top of the subcloud layer!
Better observations have helped us clarify our understanding of these plumes. In a 1962 study, an aircraft from the Woods Hole Oceanographic Institution collecting data on air temperature could only trace plumes about a third of the way up from the ocean to the cloud base. Later in the 1960s, it became possible to use humidity as well as temperature to trace thermals through their full depth. And, by the 1970s, we were able to routinely detect the “roots” of clouds using aircraft-based humidity, temperature, and wind measurements. One finding that emerged is that humidity becomes increasingly important in creating buoyancy at higher levels, where some plumes can rise even when they are cooler than the environment.
Like birds, insects help show us what the atmosphere is doing. They are carried away from the ground by updraft plumes, and they fly downward into them. Insects can be a strong source of echo in radar images that show convective structure. Figure 4, at the bottom of the page, shows plumes detected by the 3-millimeter-wavelength beam of the Wyoming Cloud Radar, flown aboard the Wyoming King Air during the 2002 International H20 Project. The picture revealed here is of continuous plumes, with embedded pulses (bubbles?).
A measurement technique that’s for the birds
Even with modern observational equipment, birds can still be useful in sensing the boundary layer. A year or two ago, I met with faculty member George Young during a visit to Pennsylvania State University. After some discussion of our common interests in boundary-layer meteorology, the conversation turned to birds, and I found out about George’s fascination with how birds react to atmospheric motions ranging from thermals to squall lines, hurricanes, and cold fronts. Thanks to George’s research, birds are not just reacting to the atmosphere—they are also reporting on it.
George told me about studying the soaring behavior of American white pelicans. His team attached pressure sensors to ten birds so that they could follow their altitude as they flew and soared. To observe the birds, the team followed them with a car or small aircraft. By watching the birds as they began to soar, the group identified when thermals started to form. They found that birds flying locally soared at low levels, while the birds flying cross-country between foraging and nesting sites flew higher. In fact, most flew near the middle of the boundary layer—between about one-fifth and four-fifths of the way to the top. This is precisely where the updrafts would be the strongest and provide the pelicans with the most lift. Thus, it is not surprising that George’s team could use the height of the pelicans as a measure of the boundary-layer depth.
George and his colleagues then went even further, using the birds to estimate the updraft speed in the thermals. The approach is straightforward. Equations for the sink rate for gliders in horizontal and circular flight can, with modification, be applied to the pelicans. You know the height and flight pattern of the pelicans, and you use current data and a simple model to determine the boundary-layer depth. Account for the sink rate, and you have the updraft speed. Use the boundary-layer depth to scale the height. Use surface conditions to scale the vertical velocity.
The resulting thermal updraft-speed profile in George’s study matched what had been found earlier through observations and in large-eddy simulations that have high enough resolution to depict thermals. The pelicans had confirmed the model and the earlier data by gathering information in a place where it would have been difficult to fly instrumented aircraft! As Icarus discovered so painfully in Greek legend, birds can do some things that are difficult or impossible for humans.
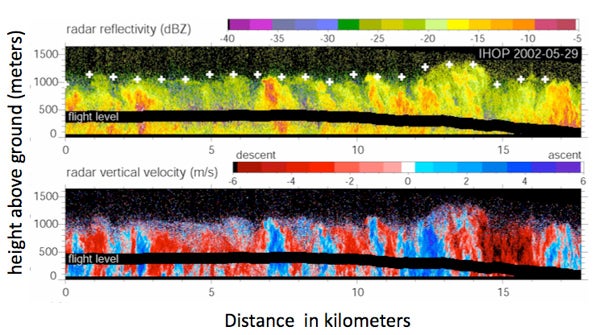 Figure 4. Plumes as revealed by signals from the Wyoming Cloud Radar reflecting off insects. The radar points upward and downward, with the plumes extending in both directions from the flight path (the dark swath across the lower part of both frames). In the top frame, the color (radar reflectivity) changes with the number, composition, and size of the insects, with reds denoting the highest values. In the bottom frame, the color changes with the vertical wind speed (positive = rising air). (Radar cross section courtesy of Bart Geerts, University of Wyoming.)
References: In addition to my conversation with Professor George Young, this blog is based on the following journal articles.
Woodcock’s work and the use of herring gulls to characterize boundary-layer convection over the ocean:
Woodcock, A.H., 1942: Soaring over the open sea. The Scientific Monthly, 55, 226-232.
Woodcock, A.H., 1975: Thermals over the sea and gull flight behavior. Boundary-Layer Meteorology, 9, 63-68.
The use of radar returns from insects to detect plumes and estimate their vertical velocity:
Geerts, B., and Q. Miao, 2005a: The use of millimeter Doppler radar echoes to estimate vertical air velocities in the fair-weather convective boundary layer. J. Atmos. Ocean. Tech, 22, 225-256.
Geerts, B., and Q. Miao, 2005b: A simple numerical model of the flight behavior of small insects in the fair-weather convective boundary layer. Environ. Entomol., 34, 353-360.
The use of aircraft data to measure the structure of horizontal convective rolls:
LeMone, M. A. and W. T. Pennell, 1976: The relationship of trade-wind cumulus distribution to subcloud-layer fluxes and structure. Mon. Wea. Rev., 104, 524-539
Early detection of plumes using temperature measurements from aircraft:
Malkus, J.S., 1962: Large scale interactions. The Sea: Ideas and Observations on Progress in the Study of the Seas. Vol. 1, M. N. Hill, Ed. Interscience Publishers, 88-294. (Fig. 53).