Snowmageddon and the not-so-wild West
Feb 8, 2010 - by Staff
Temporary impacts to NSF NCAR Road, Parking Lot and Trails
View more information.Feb 8, 2010 - by Staff
Bob Henson | 8 February 2010 • Residents of the mid-Atlantic can be forgiven if they’re craving a bit of calm. The weekend of 5–6 February brought what’s been variously dubbed Snowpocalypse II (a sequel to December’s storm), Snowmageddon (used by President Obama), Snowtastrophe, and the Superbowl Superstorm (which merited a Facebook page). Many other names have been in the running.
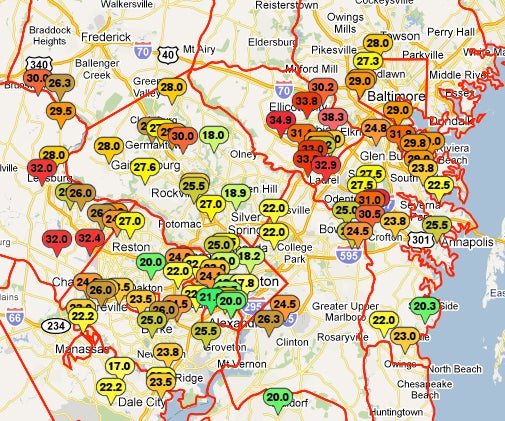 Preliminary snow totals for 5–6 January. (Courtesy Baltimore-Washington NWS.)
No matter what it’s called, it was an event to remember. Preliminary multiday totals show Washington, D.C., notching 17.8”—its fourth biggest amount since the National Weather Service was founded in 1871. Baltimore got its second heaviest, with 24.8”. The dump at Dulles International Airport was the biggest ever seen there: 32.4”. Philadelphia scored its second-heaviest snow in modern history, with 28.5”, and Pittsburg got in on the action too—its 21.1” was the city’s fourth-heaviest on record.
As noted in a thorough roundup by Capital Weather Gang, computer models were unusually consistent on this storm’s track and intensity, which gave Washingtonians and Baltimorians plenty of advance notice. The real challenge for forecasters was to nail down the storm’s northern edge, which was as sharp as any in memory. Most of the New York area saw only a trace of snow (which lent a dusting of irony to Winter Jam NYC). Yet only 60 miles to the south, Beachwood, New Jersey, got 19.0”.
The contrast impressed even a veteran like NOAA’s Paul Kocin, co-author of the definitive book Northeast Snowstorms and co-creator of the Northeast Snowfall Impact Scale. “Many storms have very sharp northern gradients, but it is pretty unprecedented to get 28 inches in Philadelphia and a trace at New York’s Central Park,” says Kocin.
Where the skies are not snowy all day
If you’re looking for a break from the meteorological drama, head west. Much of the central and northern Rockies were bypassed in January by the season’s two main features: a strong storm track across the Sun Belt, typical of El Niño winters, and repeated bouts of cold and snow across the eastern states, associated with an intensely negative Arctic Oscillation. North of Arizona and New Mexico, the resulting snowpack has been paltry (see map at bottom), making for mediocre skiing. Even further north, Olympic organizers are trucking in tons of snow after Vancouver saw its warmest January on record.
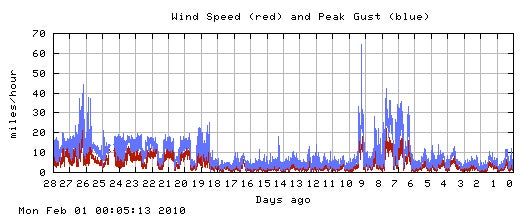 This graph of sustained wind speeds (red) and gusts (blue) shows the relative calm that prevailed at Boulder’s Foothills Lab in January 2010. The graph extends from January 3 (left) to February 1 (right), with the legend showing the number of days prior to February 1.
Left in the lurch, the Great Basin and Colorado’s Front Range saw a cold, snowy December followed by a January that was abnormally placid. On all but a handful of days, the high temperature in Boulder fell within 5°F of the daily average, which is close to 45°F. There was also relatively little snow and little wind.
Here in Boulder, we’re used to being buffeted in January: it’s typically our windiest month, with chinook and bora winds tumbling over the Rockies and slamming into town with gusts that can easily top 80 mph. This year, the January calm was downright eerie. As shown on the graph above, only five days saw wind gusts exceeding 30 mph at NCAR’s Foothills Lab. Three of those days were clustered around the passage of an extremely strong cyclone—one of the deepest ever recorded in the western United States.
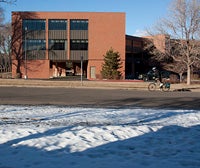 This view, looking north, shows the Sun-sculpted snowpack that formed in the shadow of NCAR's Foothills Lab, Building 4.
Without a “snow-eating” chinook to clear the landscape, Boulderites waited on sunshine to do the job. The result was a patchwork of snow and bare ground, with mini-glaciers hanging tight in shady spots (as shown by the photo at right, taken on the north side of my building, looking north).
Investigating inversions
When conditions are calm in the mountainous West, it’s easy for pollution to take hold, as grit-trapping cold air settles near the surface. Deep snow cover helps reinforce this process, so air quality is typically worst in the Great Basin in wintertime, as opposed to the summertime mix of haze and smog common across the eastern United States.
Inversions are tricky to predict—and unlike most weather phenomena, a bad forecast can make the situation worse. If people drive cars and burn wood with abandon after hearing an erroneous “green” forecast (i.e., one for good air quality that day), the resulting pollution buildup will be even worse than if a “red” forecast had prompted residents to burn less fuel.
Salt Lake City gets some of the West’s most persistent inversions, sometimes lasting for weeks. The University of Utah has now launched a three-year study of the area’s inversions. It’s being led by UU professors David Whiteman and John Horel, with scientists from NCAR and various universities also involved.
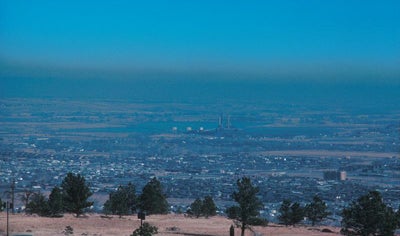 A typical inversion across Boulder, with a thin layer of pollution beneath fresher air. (Photo from UCAR Digital Image Library.)
Sharon Zhong (Michigan State University), who leads the study’s modeling component, notes that light winds and subtle variations in temperature and moisture add to the complexity of inversion prediction. “If we can improve our ability to understand and simulate cold-air pools in the Salt Lake Valley, then other researchers can apply those improvements elsewhere,” she says.
Pollution isn’t as dramatic as two feet of snow, but poor air quality kills hundreds of thousands of Americans by complicating respiratory and cardiovascular ailments. So every improvement in pollution forecasting skill is potentially as useful as the next refinement to snowpocalypse warnings.
 As of 8 February 2010, the amount of moisture in snowpack was well below average across most of the West except for California, Arizona, and New Mexico. (Courtesy Western Regional Climate Center.)