Wet, cool, and wild: The winter of 2009–2010
Apr 2, 2010 - by Staff
Temporary impacts to NSF NCAR Road, Parking Lot and Trails
View more information.Apr 2, 2010 - by Staff
Bob Henson | 2 April 2010 • Rain buckets replaced snow shovels this week for woebegone Northeasterners from New York to Boston. It was the most recent chapter of a sodden saga that brought three intense rainstorms to southern New England and the mid-Atlantic during the last half of March.
Boston, Providence, and several New York weather stations (including Central Park) notched their wettest March in more than 100 years of records. Many sites saw more than a foot of rain. At Blue Hill Meteorological Observatory, which boasts the longest continuous weather record at a single point in North America (125 years), it was the wettest month ever recorded. With 18.81", the new record narrowly beat Blue Hill's August 1955 deluge of 18.78" fed by hurricanes Connie and Diane.
Even though the region has a moist climate, it’s rare for the mid-Atlantic and New England to see rains quite this intense and prolonged outside of hurricane season. In a sense, the rains from New York to Boston were a warmer, northward-displaced continuation of the same soggy pattern that brought record-smashing February snows to an area stretching from Washington to Philadelphia.
 Compared to the period 1971-2000, global temperatures from December 2009 to February 2010 were well above normal across Canada and much of tropical and subtropical Africa and Asia. (Image courtesy NOAA National Climatic Data Center.)
Just cold enough—and more than wet enough
The colossal snows of midwinter served as convenient fodder for climate-change doubters. But the downpours of March suggest that the most noteworthy aspect of the Northeast’s winter was the intense precipitation rather than unusually cold air. Temperatures were certainly chilly in February, but not particularly brutal. Neither Philadelphia nor Washington could muster a single record low that month, and Baltimore-Washington Airport set only one.
About two-thirds of the country had a cooler-than-average winter (December to February), according to NOAA’s National Climatic Data Center. February was the 29th coldest in the nation’s 116-year record. The winter as a whole ranked 18th coldest for the contiguous United States, according to NOAA's John Leslie (personal communication).
For many areas, just as in D.C., the hallmark of this winter’s chill was its persistence more than its bitterness. Some areas that normally get a few mild days in midwinter went months without one. The consistent cold helped several cities beyond the mid-Atlantic to rack up some of their snowiest months and winters ever.
Digging deeper into this winter
What kept the nation locked in this cycle of snow and chill—and what was going on elsewhere while Americans dug out? As diagnosed by NOAA’s Climate Scene Investigators team, the U.S. winter can be explained largely by the interplay between the strongest El Niño in a decade and the most intensely negative Arctic Oscillation on record (see the AO discussion in our 8 January 2010 column).
In a nutshell, El Niño nurtured a strong, wet jet stream across the Sun Belt and up into the mid-Atlantic region. Meanwhile, the patterns associated with the strongly negative AO helped block the usual west-to-east flow of weather systems, allowing cold air masses to plunge down into eastern North America as well as much of Europe and Asia. Most of Great Britain saw its coldest winter in 30 to 50 years.
Millions of viewers discovered that not all of North America was snowbound when they tuned into the Winter Olympics and saw Vancouver, Canada, grappling with its warmest January on record. As noted in our 12 October 2009 post, there were ominous meteorological signs months ahead of the Olympics, as it became clear that an El Niño was taking shape.
One of El Niño’s strongest connections to midlatitude weather is its tendency to produce cool, wet conditions across the southern U.S. states and relatively warm, dry weather across the northern states and Canada. Parts of the Midwest were far wetter than expected—enough to bring spring floods across the Red River Valley of the North—but in many other ways, this El Niño fit the usual mold. The northern U.S. Rockies ran drier than usual, for example, while the southern Rockies were quite moist.
 Temperatures were more than 11°F (6.1°C) above average for the entire winter across parts of northeast Canada. (Image courtesy Environment Canada.)
Snowbirds, stay home
While the media focused on Vancouver’s mildness, many other parts of Canada were sharing in the balmy winter. The Arctic and North Atlantic coasts were incredibly warm, leading to premature ice melt in some areas. For example, the town of Nain in the province of Newfoundland and Labrador reaches a high of –15°C (4°F) on a typical midwinter day. At noon on 14 February, it was raining and 2°C (36°F). It was “crazy warm,” as a CBC weathercaster put it in January and February blog posts.
Canada as a whole experienced its warmest and driest winter on record—“beyond shocking,” according to senior climatologist David Phillips of Environment Canada, especially because it sets the stage for summer wildfires that could be ferocious. Globally, it was among the 10 warmest December-to-February periods on record, as evident on this NOAA graphic. The contrast between U.S. chill and global warmth was even more pronounced this winter than it was last summer (see the global temperature map, above).
A moving yardstick
At the Netherlands Meteorological Institute (KNMI), Geert Jan van Oldenborgh carried out an interesting analysis of the 2009–2010 northern winter, comparing it to the 1971–2000 average (typical of the 30-year periods used for climatological studies). He found that one would expect temperatures similar to this past winter’s readings every 10 to 20 years across parts of the U.S. South and once every 100 years in parts of western Siberia. The warm extremes were more impressive, with return periods as high as once every 200 years in parts of Canada and Greenland and higher still across northern Africa and the Middle East.
Of course, the climate hasn’t been stationary since the 1970s. So van Oldenborgh did a similar comparison that takes each location's warming trend, rather than a fixed period of temperatures, into account. In this light, the past winter’s cold becomes more impressive: much of the southern and central United States would expect such cold only every 20 to 50 years. Still, the mildness of northern Canada, northern Africa, and the Middle East stands out like a warm sore thumb (see graphic below).
“The winter of 2010 was mainly notable because of the large amounts of snow in Europe and the United States. The temperature deviation [there] was less exceptional,” van Oldeborgh concludes. However, he adds, “Statistically, the high temperatures in North Africa and the Middle East were very rare.”
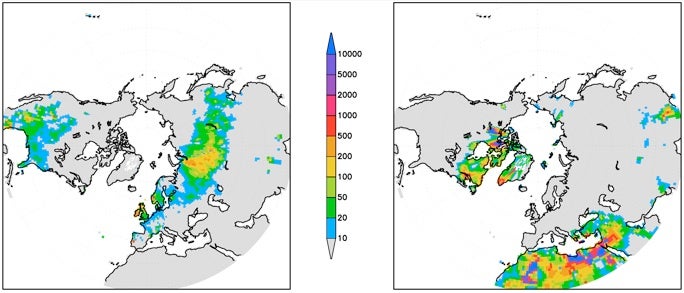 Return times (statistical likelihood of an event recurring in x number of years) for cold temperature extremes (left) and warm temperature extremes (right) during the period from December 2009 to February 2010, relative to the recent trend in global temperatures. (Image courtesy Netherlands Meteorological Institute—KNMI.)