Sizing up cyclones
NCAR scientists propose new index for evaluating potential hurricane storm damage
May 18, 2016 - by Staff
Temporary impacts to NSF NCAR Road, Parking Lot and Trails
View more information.May 18, 2016 - by Staff
UPDATE: 2016 SEASONAL FORECAST
The NCAR-based Engineering for Climate Extremes Partnership (ECEP) has issued its first seasonal forecast using the Cyclone Damage Potential index. The forecast is for a hurricane season with higher-than-average potential to cause damage. This year's forecasted seasonal CDP is 5.7, compared to an average seasonal CDP of 3.7 for the years 1981 - 2010. For more details, visit the ECEP website.
May 18, 2016 |In early July 2005, Hurricane Dennis, a Category 3 storm on the Saffir-Simpson Hurricane Wind Scale, was bearing down on the Gulf Coast. Anyone paying attention would have been forgiven for having a foreboding sense of déjà vu.
Just 10 months earlier, another Category 3 storm, Hurricane Ivan, had followed a strikingly similar track, making landfall just west of Gulf Shores, Alabama. Ivan ravaged the region, ultimately causing an estimated $18.8 billion in damages. But Dennis, despite roaring ashore in practically the same neighborhood, caused only $2.5 billion in damages—less than one-seventh that caused by Ivan.
The fact that two Category 3 hurricanes making similar landfall less than one year apart had such different impacts illustrates a weakness in the Saffir-Simpson scale, the system most commonly used by weather forecasters to categorize hurricane risk.
Scientists at the National Center for Atmospheric Research (NCAR)—in collaboration with global insurance broker Willis—have developed a new index that they suspect can do a better job of quantifying a hurricane's ability to cause destruction. The Cyclone Damage Potential index (CDP) rates storms on a scale of 1 to 10, with 10 being the greatest potential for destruction.
A prototype for an app that will allow risk managers to easily use the CDP to identify local damage potential is already available and will be among the first tools included in the beta version of the NCAR-based Global Risk, Resilience, and Impacts Toolbox when it is released later this year.
 Infrared satellite imagery of Hurricane Ivan (left) and Hurricane Dennis (right). Both storms were rated Category 3, both made landfall in almost the same area, and yet they caused vastly different amounts of damage. Click to enlarge. (Images courtesy NOAA.)
On the frequently used Saffir-Simpson Hurricane Wind Scale, hurricanes are placed in one of five categories, based on their sustained wind speeds. On the low end, Category 1 storms have sustained winds between 74–95 mph and are expected to cause "some damage." On the high end, Category 5 storms have sustained winds of 157 mph or higher and are expected to cause "catastrophic damage."
Because the Saffir-Simpson scale relies solely on sustained wind speeds, it does not take into account all the characteristics of a storm linked to its destructive power.
"Hurricane wind damage is driven by more than simply wind speed," said James Done, one of three NCAR scientists who worked on the CDP. "The hurricane's size and forward speed also are important. A large, slowly moving hurricane that repeatedly batters an area with high winds can cause greater total damage than a smaller, faster hurricane that blows quickly through a region."
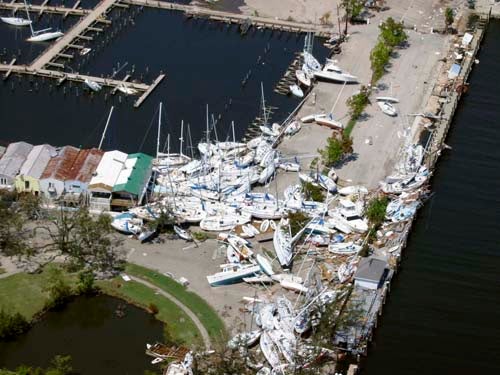 Damage caused to a marina in New Orleans by Hurricane Katrina. Katrina would have received a CDP rating of 6.6, compared to a 5.0 for Hurricane Ivan and a 2.4 for Hurricane Dennis. (Image courtesy NOAA. Click here for high resolution.)
For example, the critical difference between Ivan and Dennis turned out to be hurricane size, according to a study of the storms by Done and Jeffrey Czajkowski at the University of Pennsylvania's Wharton Risk Management and Decision Processes Center.
To create the CDP, the scientists incorporated hurricane size and forward speed into their index, along with sustained winds. To determine the relative importance of each, the team used hurricane damage statistics from the hundreds of offshore oil and gas facilities that pepper the northern Gulf of Mexico. Because facilities are spread more-or-less evenly across the region, their exposure to hurricanes is approximately the same. Damage differences from storm to storm can therefore be attributed to differences in the storms themselves.
The CDP does not predict actual damage – which could vary markedly, depending on where (or if) a hurricane makes landfall – but instead predicts the storm's potential.
When applying the CDP to past hurricanes, the index was able to discern a difference between Ivan, which would have scored 5.0 on the CDP prior to landfall, and the much smaller Dennis, which would have earned a 2.4. The CDP rating for Hurricane Katrina, which ultimately caused more than $80 billion in damages in 2005, would have been 6.6.
“The value of the index is in comparing current storms with storms from the past," Done said. "For example, if a hurricane is approaching New Orleans, you can compare its CDP with Hurricane Katrina's CDP and get a fuller picture of how much damage the storm is likely to cause."
The CDP project was led by NCAR scientist Greg Holland, along with NCAR colleagues Done, Ming Ge, and Willis collaborator Rowan Douglas.
From today's storm to tomorrow's climate
In its original form, the CDP can be easily applied in real time to existing hurricanes. But Done also wanted to find a way to examine how hurricane damage might change in the future, especially as the climate warms.
The question of how climate change may influence hurricanes has been difficult to answer, in part because global climate models are typically not able to "see" the small-scale details of individual storms. Though some scientists have run climate models at a resolution that is fine enough to study hurricane formation, the effort requires so much computing power that it hasn't been practical to replicate on a large scale.
To skirt this problem, hurricane researchers have looked for links between hurricane activity and phenomena that climate models can see—for example, the sea surface temperatures of ocean basins.
"People have used large-scale variables to infer tropical cyclone activity for decades," Done said. "I've done a similar thing, but instead of predicting how many hurricanes will form, I’m predicting hurricane damage potential."
To make this "climate" version of the CDP, Done – together with NCAR colleagues Debasish PaiMazumder and Erin Towler, and Indian Space Research Organization collaborator Chandra Kishtawal – looked for variables in the large-scale environment that could be correlated to the three variables used for the original CDP: sustained winds, size, and storm speed.
The team found that "steering flow," the winds that would blow along a hurricane, is correlated with forward speed. They also found that relative sea surface temperature – the difference between temperatures in the Atlantic and Pacific ocean basins – is linked to seasonal average hurricane intensity and size. This is because relative sea surface temperatures affect wind speeds higher up in the atmosphere, which in turn affect hurricane formation.
The result is an index that can spit out a damage potential rating for a season, a year, or even longer, without needing to predict how many individual storms might form. Such forecasts are of interest to large reinsurance companies, like Willis Re and others.
"This technique enables us to translate our climate model simulations into information about extreme events that’s critical for businesses and policy makers,” Done said.
Writer/Contact
Laura Snider, Senior Science Writer and Public information Officer
Funders
Research Partnership to Secure Energy for America
Willis Re
Collaborators
Engineering for Climate Extremes Partnership
Willis Re