A road trip through a “fair-weather” cold front
Aug 12, 2010 - by Staff
Early closure on July 3 and 4 - NSF NCAR Road, Parking Lot and Trails
View more information.Aug 12, 2010 - by Staff
Margaret LeMone | 16 August 2010 • Cold fronts are funny things. Sometimes they can sneak by without you knowing precisely when they’ve done so. Other times they are unmistakable. Fronts often come with thunderstorms, sometimes severe, but even those that pass by without any rainfall or snowfall at all can be worth a closer look.
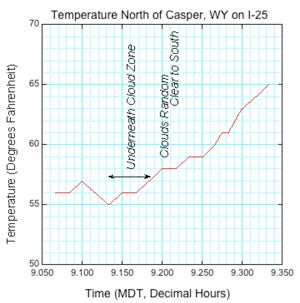
Figure 1. Temperature plot of front north of Casper. The car was traveling at about 75 mph (0.8 miles per minute) toward the south. Note that the temperature was fairly steady north of the front, with gusty winds. South of the front, there was less wind, and the temperature settled at 66-67°F until about 10 a.m.
Often, cold fronts change in response to the daily heating cycle. In the Northern Hemisphere, it’s fairly common to have clouds north of a front, but clear skies or scattered clouds to the south. In this case, daytime heating would be more intense in the clearer air to the south of the front. This will strengthen the front, while nighttime cooling will weaken it.
This all happens in the atmosphere’s lowest layer of air, called the boundary layer, where the temperature can swing up or down in a matter of hours by more than 20°F (14°C) in response to the heating or cooling of the surface.
Boundary-layer meteorologists from all over the world met this month for a conference at which they discussed turbulence, heating and cooling, and much more. This meeting, sponsored by the American Meteorological Society, included papers on the boundary layer in cities and over rural areas; it even dealt with meteorological aspects of wind power. Among other things, boundary-layer research enables us to understand how fronts evolve near the surface and how to represent those processes in numerical weather prediction models.
Although I’ve witnessed several frontal passages, I can recall only four times that I could actually document the frontal zone itself—and one of those times was based on data from an airplane flying back and forth through a front.
So it was really exciting this past July when my husband, Peter, and I found ourselves driving south through a well-defined cold front as we headed from Montana to our home in Colorado. Better yet, I was not driving, so I could monitor the cloudiness, wind, and even temperature, since our car has a sensor that seems reasonably accurate. At the end of this post you'll find a table of photos and a map relating each picture to the location where we shot it.
Well to the north of the front—between Buffalo and Casper, in Wyoming—I noticed that the clouds were organized in "streets," or rows, aligned almost perpendicular to the highway. You could actually see the cloud shadows lined up on the ground. If they were parallel to the strong winds we were experiencing, then these clouds formed the top of upwelling currents extending up from the ground. If not, they could have been associated the crests of atmospheric waves riding atop the cool air mass.
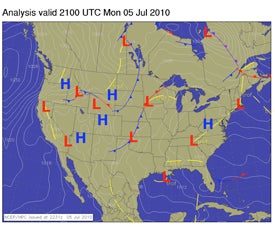
Figure 2. In spite of the ambiguous temperatures on the synoptic scale, the analysis for that afternoon shows a stationary front stretching across Wyoming.(Courtesy NCAR Real-Time Weather Data.)
On the front line
As I took a series of pictures of the cloud streets and their shadows, Peter noticed a thickening of the clouds to the south, and speculated that it could be the cold front that had passed over us while we were still in Montana. Once we found a place to pull off, we stopped so that I could take a picture of the clouds to the south. By this point, it was about 9:00 a.m.
As we continued farther south, passing through the front, I recorded the times, temperatures, and mile markers, so that we could reconstruct the frontal structure later. I was planning to photograph the clouds in Casper, where we’d be stopping for gas, but once we got there (between 9:20 and 9:30 a.m.) our view was blocked and there was no chance to see the clouds to the north.
The temperature rise to the south of the front was significant. Figure 1 (above) shows a plot of the temperatures measured from our car as we drove south along I-25.
As we drove east from Casper, the frontal cloud zone was visible to the north. We originally thought the zone was oriented east-west, but as we traveled eastward, it become obvious that the clouds were actually oriented more from the southeast to northwest. Winds south of the front were light (5–10 miles per hour in Casper) and out of the southwest.
Meanwhile, back at the maps
How did our impressions agree with the synoptic situation? Figure 3 (bottom of page) shows the temperature field at about the time we were recording our data. The winds clearly reflect the position of the front, but the temperatures at the stations do not show as much contrast as we saw locally. In fact, some of the readings ahead of the front are cooler than those behind it! By afternoon, the front had apparently stalled, as shown by the stationary front (alternating blue and red segments) bisecting Wyoming on the 3:00 p.m. MDT weather map (Figure 2, above).
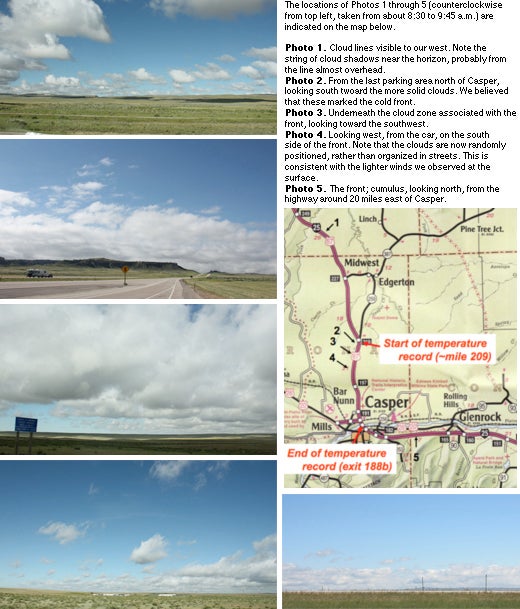
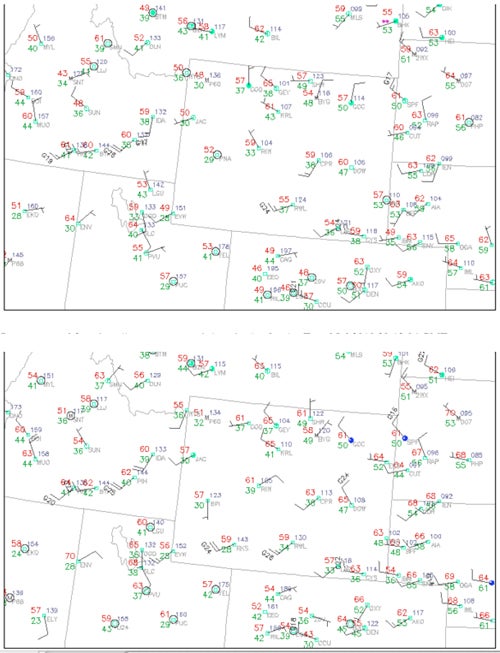
Figure 3. Surface observations at 0843 MDT (top) and 0943 MDT (bottom) on 5 July 2010. Red numbers indicate air temperature. Casper (labeled CPR) is located near the center of Wyoming, with a temperature of 59 and 63 in the top and bottom frames, respectively. (Courtesy NCAR Real-Time Weather Data.)