Sea ice and hurricanes: Two big wins for seasonal prediction
Dec 2, 2010 - by Staff
Temporary impacts to NSF NCAR Road, Parking Lot and Trails
View more information.Dec 2, 2010 - by Staff
Bob Henson | 3 December 2010 • Issuing a five-day weather forecast was once a daring enterprise. Today, we’re not only accustomed to long-range weather forecasts but also to seasonal-scale outlooks for some events. This year offers two good examples of how far we’ve come.
In both cases, forecasters now draw on an increasingly large toolbox of techniques to produce their increasingly skillful results.
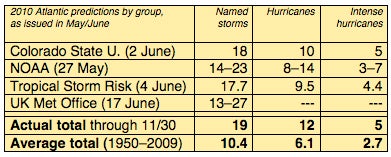
The tropical Atlantic, whose six-month hurricane season closed on 30 November, was about as busy as it ever gets. There were 19 named storms, 12 hurricanes, and 5 intense hurricanes (those at Category 3 or greater on the Saffir-Simpson scale). All of these totals are close to double their annual averages for the last six decades, putting 2010 among the top years on record in each category. Jeff Masters (Weather Underground) provides a bumper crop of other statistics in his excellent recap of the Atlantic season.
In terms of storm count, the leading hurricane-prediction groups did remarkably well with forecasts issued near the start of the season, as shown in the box above. (For a more detailed breakdown of 2010 predictions, visit Tropical Storm Risk to download the PDF at the “Atlantic Hurricanes 2010” link, and then look for Appendix I.)
Where do these numbers come from? Colorado State University’s William Gray kicked off the seasonal-prediction game in 1984 with a statistics-based method. Gray developed equations that weigh each of several factors correlated with the strength of the hurricane season to come—for instance, the average sea-surface temperatures observed each spring in the parts of the tropical Atlantic where hurricanes form, or the average amount of rainfall over the African Sahel. Over the years, Gray and his colleagues (including Philip Klotzbach, who now manages the CSU forecasts) have refined their approach, settling on a small group of variables and incorporating various adjustments.
The CSU forecasting philosophy is a pragmatic one: even if the interactions that shape a hurricane season aren’t fully understood, it’s still possible to generate forecasts with value. As Klotzbach and Gray note, “There is a maze of changing physical linkages between the many variables.”
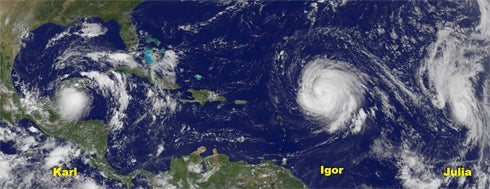
For only the second time on record, two simultaneous Category 4 hurricanes prowled the Atlantic on 15 September—Igor and Julia (far right). Meanwhile, Karl (far left), a Category 3 storm, became the strongest hurricane ever recorded in the Bay of Campeche. (Image courtesy NASA-GSFC; data from NOAA GOES.)
NOAA’s seasonal hurricane outlooks, issued since 1999, specify ranges and probabilities rather than single numbers. For example, while CSU called for 18 named storms in its June outlook, NOAA predicted 14 to 23 storms and assigned 70% odds that the final number would fall within that range. Similarly, the U.K. Met Office called for a 70% chance of 13 to 27 named storms.
To a trained eye, it was obvious that 2010 had the makings of a busy hurricane season. Sea-surface temperatures across much of the tropical Atlantic were at record levels as early as February, and by late spring the likelihood of a La Niña was growing. NOAA based its outlook largely on these two factors as well as the multidecadal pattern of busy seasons that’s been in place since the mid-1990s. In addition, NOAA consulted the output of dynamical computer models from the U.S., U.K., and Europe that can project ocean-atmosphere relationships months into the future. The Met Office based its outlook entirely on the British and European dynamical models.
When it comes to predicting where a given year’s storms will strike, there’s still far more work to be done. NOAA does not issue landfall outlooks, but CSU called for almost twice the climatological odds of hurricane strikes in 2010 along the Gulf and Atlantic coasts. Yet only a single weak tropical storm made U.S. landfall. It’s the first time this many hurricanes have avoided American shores.
Meteorologists explained the oddity by noting such factors as an eastward displacement of the Azores high-pressure cell that often steers storms toward the Gulf and Atlantic coasts. However, nobody knows exactly why the Azores high set up where it did.

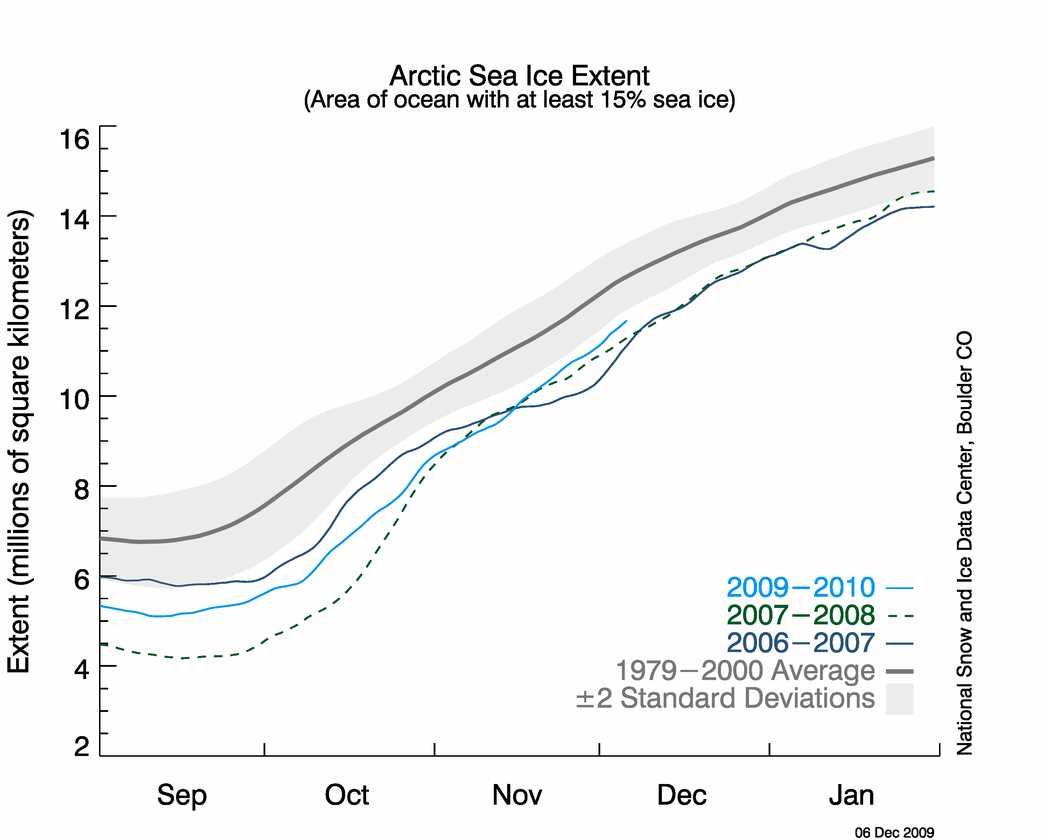
On 29 November 2010, Arctic sea ice extent had fallen below 2007 values, putting it near the seasonal extent observed in 2006. (Image courtesy National Snow and Ice Data Center.)
As hurricanes spun across the Atlantic, sea ice across the Arctic Ocean trudged through another summer of slow decay. At its seasonal minimum (which occurs each September), the ice now spans about 20–30% less area than it did in the 1980s. This year the ice teased researchers: it hit a false bottom on 10 September, appeared to start its autumn recovery, but then dropped again to a final low of 4.60 million square kilometers on 19 September.
In the end, 2010 wasn’t a record year for ice loss—that dubious honor still belongs to 2007—but it did take the bronze medal, coming in at third place just behind 2008, according to the National Snow and Ice Data Center (NSIDC).
For the second year, Arctic researchers and lay scientists have pooled their predictions in the Arctic Sea Ice Outlook, issued each month from June through August by the Arctic Research Consortium of the U.S. On this site, you’ll find the outlook furnished by each participant, including the rationale behind their forecasts, as well as the mean value (the average of the forecast values provided from all participants). Note that these predictions are for the mean ice extent for September as a whole, as opposed to the single-day minimum.
Although the various seasonal hurricane prediction teams were all roughly on the same page in 2010, there was a much broader variance among sea ice forecasters. When the group issued its first forecasts in June for the average September extent, the numbers ranged from 4.2 to 5.7 million sq km (see graphic). However, the group-averaged value of 5.0 million sq km ended up strikingly close to the actual value of 4.90 million sq km.
Like the seasonal hurricane outlooks, the sea ice forecasts are mainly produced in two ways:
Several of the group members introduced new elements to their forecast schemes this year. See this PDF file (gleaned from the bottom of the June outlook) for full descriptions of each scheme.
Scientists are still learning the limits of sea ice predictability. Months ahead of time, it’s impossible to predict the specific, short-term weather patterns that drive ice loss during the peak melt season, just as seasonal hurricane forecasts can’t tell you where each tropical cyclone will move. Over the longer term, researchers don’t yet know whether summer ice extent will plummet to dramatic new lows soon or hover around a “new normal” value for years before resuming its downward slide. Among the researchers looking at the inherent predictability of sea ice in the rapidly changing Arctic are NCAR’s Marika Holland, who recently investigated the topic using NCAR’s Community Climate System Model (CCSM3).
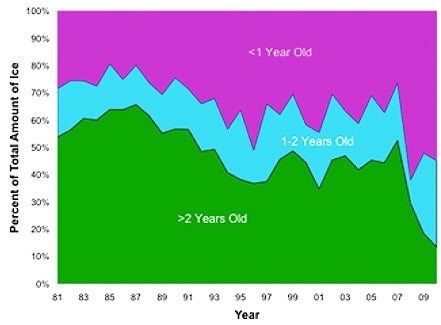
Estimates of Arctic sea ice age show a marked drop in the fraction of ice more than two years old, particularly since 2007. (Image courtesy James Maslanik and Chuck Fowler, University of Colorado at Boulder.)
Even more ominous than the drop in ice extent is the loss of thick multiyear ice, which is typically the most resistant to melting. The extent of Arctic sea ice that’s at least five years old has declined by more than 95% since the 1980s, according to data from James Maslanik (University of Colorado at Boulder) cited by NSIDC in its 2010 wrap-up. As shown in the graph at right, there’s a fairly large amount of one- to two-year-old ice (pale blue) that will age this winter, but there’s no telling how much of this new generation will make it to sea ice adulthood.
What’s most striking for NCAR’s Jen Kay, who studies the relationship between Arctic weather and sea ice, isn’t a single year’s results so much as the long-term picture. Northern sea ice has now been on the decline for 30 years – which happens to be the standard length of time that meteorologists use to calculate climate variables at a given spot.
“Thirty-year declining trends in Arctic sea ice extent of the magnitude that we have observed do not occur in 20th-century climate model runs with only natural variability or natural forcing, such as solar variations and volcanoes.” says Kay. “In fact, the longer the declining sea ice trend, the easier it is for scientists to attribute it to increasing greenhouse gases.”