An atmospheric river runs wild
Dec 22, 2010 - by Staff
Temporary impacts to NSF NCAR Road, Parking Lot and Trails
View more information.Dec 22, 2010 - by Staff
Bob Henson | 22 December 2010 • More than 13 feet of snow in the Sierras, torrential rain in Los Angeles, unseasonal floods in Utah—something’s up with the weather this week. It’s all related to a moisture-laden current flowing from the subtropical North Pacific across California and into the Rockies.
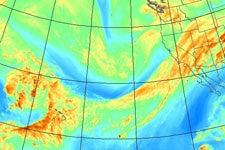
A channel of moisture running from Hawaii (lower left) to the western U.S. is clearly visible on this depiction of water vapor collected at 4 p.m. PST on 20 December 2010 by NOAA's Geostationary Operational Environmental Satellite. (Image courtesy Naval Research Laboratory.)
Strong jet streams often plow into the West Coast in wintertime. The heaviest rains and snows occur when the flow dips far south over the Pacific, allowing it to bring warm, moist air from the subtropics to California. It’s a pattern often referred to as the Pineapple Express, which implies that Hawaii is the source of the mildness and wetness. This isn’t always the case, though, so a less flavorful name for the phenomenon—an atmospheric river, or AR—has been gaining favor among researchers.
This week’s river has been a wild one. In the last week it’s delivered more than 6 inches of rain to Los Angeles and more than 21 inches of rain to parts of the L.A. foothills, making it one of the wettest December storms on record. In southern Utah, some areas saw more than 15 inches of moisture from rain and/or snow, leading to major flooding and the first evacuation of Zion National Park in memory. It’s the worst kind of holiday surprise for Utahns, who normally get flooding during late-spring snowmelt and late-summer monsoons rather than on the winter solstice.
The rain even made it to Colorado's mountains, where the ski town of Aspen got a day's worth of liquid in place of the champagne powder that's far more common around the holidays.
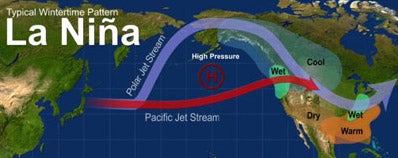
One of the best depictions we've found of La Niña influences on North American weather during the northern winter. (Courtesy NOAA.)
Not only are some of these rains setting records—they’re falling in places where this winter was expected to be on the dry side. When a moderately strong La Niña is under way, as is now the case, the odds are boosted for a wet winter across the Pacific Northwest, while conditions tend to be drier than usual from southern California across to the southern Rockies. The separation zone lies close to 40°N latitude, roughly from San Francisco to Denver, though it can vary as the winter unfolds. See this very cool animation from AgroClimate, a university consortium.
Why did this week’s heavy rain and snow take an unusual path? A huge center of high pressure in the northeast Pacific pushed the jet stream’s trajectory southward, notes NCAR’s Kevin Trenberth in an interview with San Francisco’s KQED. Such features are part of weather’s natural variability, Trenberth adds, although global warming tends to make wet systems even wetter.
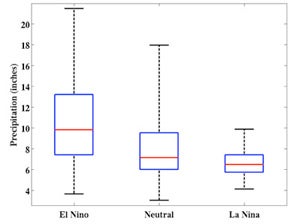
This graphic from a NOAA “box and whiskers” analysis for climate division 93 in southern California (see map) shows how rainfall during La Niña winters (right) compares to that in neutral years (center) and El Niño years (left) for the period from 1950 to present. In each case, the blue box shows amounts for December through February for the middle 50% of years, while the wettest and driest 10% of years would fall above and below the black whiskers. The central red lines indicate the average. (Image courtesy NOAA Climate Prediction Center.)
There’s more to winter than a single month, of course. La Niña’s dry signal across the southwest U.S. often intensifies into late winter and spring (also visible in the AgroClimate animation).
“It is still pretty early in the rainfall season. A big ridge in January and February could shut things down quickly,” notes Jan Null (Golden Gate Weather Services). He’s a retired National Weather Service forecaster in the San Francisco area who’s studied El Niño and La Niña effects on California precipitation for years.
Even if the winter as a whole turns out to be wet for Los Angeles, that wouldn’t be unprecedented for La Niña. As shown in the graphic at left, at least 10% of La Niña winters (December–February) since 1950 have seen precipitation well above average near the southern California coast. For its part, NOAA’s Climate Prediction Center is sticking to its forecast of a drier-than-usual January and February across the southwest U.S.
All this is a good reminder that El Niño and La Niña don’t guarantee a particular outcome—they simply load the atmospheric dice.
When Californians hear about the Big One, they typically picture a teeth-rattling, multi-billion-dollar earthquake. A team of researchers is now examining how a truly catastrophic winter storm might wreak comparable havoc on the state.
The ARkSTORM project, led by the U.S. Geological Survey, will unveil its emergency preparedness scenario in January. They’ve put together historical analogs, atmospheric and geologic computer models, and sociological factors to analyze a fictional winter storm stronger than anything observed in human memory—a souped-up, prolonged version of this week’s atmospheric river.
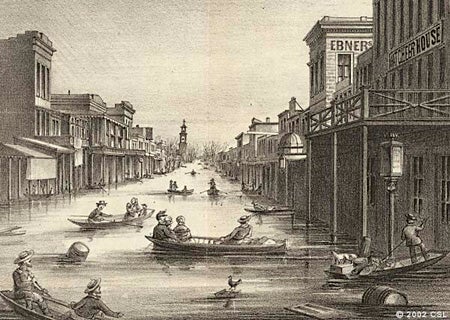
Floods indundated downtown Sacramento in January 1862. (© California State Library, California History Room; courtesy Sacramento History Online.)
The ARkSTORM prototype draws on a real-world event. In the winter of 1861–62, a phenomenal set of storms put a huge swath of California under water, including most of the Central Valley—the state’s agricultural heart. The state capital had to be moved from Sacramento to San Francisco, but even there, some 24 inches of rainfall were reported in January alone, according to Null. In Los Angeles, the winter’s total reached 35 inches.
NCAR’s James Done has been carrying out visualizations of ARkSTORM’s prototype, drawing on data from NOAA. He’s also looking at 89 years of county-by-county rainfall records to determine what are known as return periods (for example, a 100-year flood). To do this, Done is examining rainstorms that lasted anywhere from 3 to 30 days and calculating a return period for each length—for example, how often might we expect 10 inches of rainfall in 3 days. Would it be every 10 years? Every 50 years?
In addition, says Done, “We plan to calculate the return period of the entire ARkStorm event to put it in historical context.”
A caveat: Just as La Niña doesn’t always give you what you expect, return periods are also based on probabilities, not certainties. It’s entirely possible to get a 500-year flood twice within two years; here’s a hydrologist’s explanation. The rainfall that led to epic (though underreported) flooding in Nashville, Tennessee, last May was rated as a 1,000 year event—but that doesn’t necessarily mean it’ll take until the year 3000 for a similar deluge to recur.
The upside to California’s big rains is that they’ll help to refill reservoirs that have limped through years of drought. In October, Lake Mead dropped to its lowest level since the reservoir was built in the 1930s. The state is nearly free of immediate drought, according to the weekly U.S. drought monitor—but it’ll be no easy task to get the region’s longer-term water storage back in shape.