Did forecasters nail the big Northeast snow?
Dec 30, 2010 - by Staff
Temporary impacts to NSF NCAR Road, Parking Lot and Trails
View more information.Dec 30, 2010 - by Staff
Bob Henson | 30 December 2010 • Perspective is everything in weather prediction. We’ll never be able to forecast a winter storm or cold front more than several weeks in advance, or so we’re told by chaos theory. And we’d be foolish to expect a next-day outlook boasting pinpoint precision to a city block or to the nearest minute.
Still, it’s good to remind ourselves how far weather prediction has come in recent years. The ferocious winter storm that assailed the U.S. Atlantic coast this week offers a great case in point. The forecasts weren’t perfect by any means (and officials didn't always act on them), but people who paid attention to the news knew several days in advance that a windy, heavy snow was quite possible on Sunday and Monday, 26–27 December, along and near the coast from Virginia to Maine. And that’s exactly what transpired.
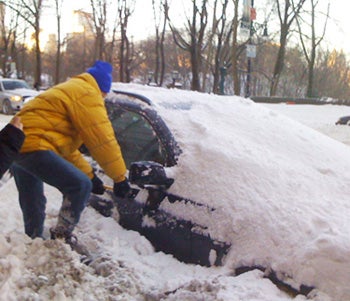
Snowbanks higher than three feet (one meter) trapped many vehicles in the New York area, including this one on Central Park South. (Photo by Zhenya Gallon, UCAR.)
Those planning travel during the post-Christmas crunch got plenty of notice that having a Plan B would be wise. The storm wreaked havoc on road, train, and air transport throughout the region, with as many as 10,000 flights reportedly cancelled. At New York’s Central Park, the snowfall of 20 inches (51 centimeters) was the sixth biggest in Manhattan’s 145 years of weather records, with massive drifts to boot. Norfolk, Virginia, notched 14.2” (36 cm), its third biggest storm total in more than a century of weather watching.
Forecasts of storms like these are better than ever thanks to a variety of innovations over the last decade, many of them rooted in research at NOAA, NCAR, universities and elsewhere. More information from satellites and other sources is making its way into computer forecast models. The models themselves are much more detailed. In turn, that improves their ability to capture the many forces in play as a winter storm takes shape, including the massive amounts of heat released as water vapor condenses to form raindrops and snowflakes.
For a good example of how forecasts went wrong prior to these improvements, let’s take a look at the infamous snowstorm of 24–25 January 2000. Only a few days earlier, NOAA’s National Weather Service had announced the installment of a new supercomputer dedicated to running daily forecast models. As an NWS announcement put it, the agency was on its way toward becoming “America’s no-surprise weather service.”
Then, with exquisitely perverse timing, the 24–25 January snowstorm reared its head. Just one day before the storm hit, the NWS’s Eta forecast model had called for the heaviest rain and snow to stay well offshore (here’s a summary). Instead, the system ended up hugging the coast, with disastrous results. Instead of the flurries they’d expected, people in Raleigh, North Carolina, saw the city’s biggest snow ever: 20.3” (52 cm). And the Washington area—home to the new supercomputer—got more than a foot of snow after a mere inch had been predicted the evening before.
A group led by Fuqing Zhang (then at NCAR and Texas A&M University, now at Pennsylvania State University) analyzed this forecast fiasco in detail in a study published in 2002 in the journal Monthly Weather Review. Among other findings, the group discovered that the Eta model’s horizontal resolution—32 kilometers (20 miles) between each grid point—couldn’t capture the moisture-related dynamics critical to the storm’s evolution.
When the team simulated the same storm using a higher-resolution NCAR/Penn State research model, they obtained a better forecast of the storm’s location and strength and, especially, its precipitation. The biggest benefits came when the grid spacing dropped to 10 km (6 mi); there was comparatively less improvement when the resolution tightened further to 3.3 km (2 mi).
This study provided ammunition for plans already in the works. At the time, a multiagency team was building the Weather Research and Forecasting model (WRF), which would include versions tailored for both research and operations. The NWS now runs the latter version, dubbed the WRF Nonhydrostatic Mesoscale Model (WRF-NMM), four times each day at a resolution of 12 km (7 mi).
The ill-fated 2000 forecast was also degraded by errors in the initial conditions fed to the Eta model. Several important upper-level wind observations were missing, and the model rejected at least one valid data point. Zhang and colleagues found that omitting data from even a single radiosonde launch thousands of miles away could have had a big impact on the precipitation forecast a day later.
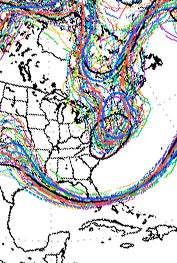
This graphic, generated using the North American Ensemble Forecast System, shows where 40 different model runs (or ensemble members) placed two 500-millibar contours (528 and 570 decameters, or tens of meters above the surface) in forecasts issued at 00Z on 24 December (7 p.m. EST on the 23rd) for 06Z on 27 December (1 a.m. on the 27th). It’s clear that the operational GFS run (black circle surrounding the mid-Atlantic) was at odds with the other ensemble members, which had the same contour considerably farther north. The ensembles were in closer agreement on the 570-dm contour looping around Florida. The forecast system is a joint U.S.–Canadian effort.
Today, the NWS assimilates much more data from satellite and other sources before a model begins to run, thus reducing the potential for errors to take root. Further improvements are on the horizon, as advanced techniques for data assimilation are now being tested and used at several modeling and research centers around the globe.
Although the current crop of models ended up doing a good job on this year’s East Coast storm, it took them awhile to come into agreement. More than a week in advance, NOAA’s long-range Global Forecast System model (GFS) hinted at a major East Coast storm. Several days later, it backed off—just as the flagship model at the European Centre for Medium-Range Weather Forecasts (ECMWF) began calling for more than two feet of snow. A couple of days later, the models switched roles again, with the GFS predicting a major snow as far inland as Washington, D.C.
Flip-flops like these can give a forecaster heartburn. But there’s now a calming ingredient in the medicine cabinet: ensembles. In addition to their “main” operational runs, several major models are now run more than a dozen additional times every six hours, with the starting conditions varied slightly each time to randomize potential error. NOAA and Environment Canada collaborate on a joint ensemble system for North America, and NOAA also runs shorter-range ensembles, with the probabilities of various outcomes calculated as percentages.
By looking at the average across each ensemble, as well as the range, or spread of results, among its members, forecasters can get a sense of what’s possible as well as what’s most probable. In some East Coast winter storms, the big question is whether warm air will sweep inland and turn the precipitation to rain. This time, it appeared enough cold air would stay in place to ensure snow in most areas. However, ensemble members differed on whether the storm would move close enough to the coast for heavy snow to fall over land.
Official NWS forecasts aren’t structured to allow for “either/or” statements, so many forecasters split the difference, calling for “significant” snow and high wind without getting too specific too early. In other NWS products, such as online discussions, forecasters laid out the spectrum of possibilities. Similarly, The Weather Channel emphasized the split between offshore and onshore scenarios, showing how each might unfold. No doubt some viewers would have preferred a more definitive outlook, especially on a busy travel weekend. But the two-pronged approach was an honest reflection of what meteorologists actually faced. Even with perfect models, there would still be inherent uncertainties in the evolution of a storm.
“The ensemble forecast is better than a single forecast, in the sense that it gives an estimate of the fundamental uncertainty in predicting any particular weather situation," says NCAR’s Richard Rotunno, a coauthor on the Zhang paper. “But one should keep in mind that the ensemble forecast does not decrease that fundamental uncertainty.”
Another coauthor, NCAR’s Chris Snyder, adds: “One difference between the ‘surprise’ case of 2000 and the recent storm may be that the human interpretation of the model forecasts this time was more cautious.” Even now, any single ensemble member can still be well off the mark. However, the presence of many other members makes it easier for meteorologists to hedge their bets smartly. Back in 2000, says Snyder, “The forecasts did not acknowledge the possibility that a typical track error could completely change the precipitation pattern.”
Still, the models themselves have undeniably improved. Nearly all of the model forecasts available a day or more ahead of the 2000 storm sent the system out to sea, according to Stephen Jascourt, who develops forecaster training on numerical weather prediction for UCAR’s COMET Program while stationed at NWS headquarters in the Washington, D.C. area. Today, says Jascourt, “Model, data, and assimilation improvements have all made a difference.”
Forecasts issued every six hours by the operational GFS model (top) and WRF-NMM model (bottom, also referred to as the North American Mesoscale Model or NAM) initially differed on the track of the northeast U.S. snowstorm. (See enlarged version for more detail.) However, by Christmas Eve (fourth panel from left: 00Z 12/25, which is 8 p.m. EST on 24 December), the models agreed that areas from North Carolina to Maine could see more than 1” of precipitation, which would correspond to 10” or more of snow. Ongoing improvement in the models can be seen in the far right panel, which shows forecasts from an experimental NAM configuration that will likely become operational in mid-2011. It produced a forecast as skillful as the one generated by the operational WRF-NMM six hours later. (Courtesy Stephen Jascourt, UCAR.)
By Christmas afternoon, as the storm center was taking shape off the Gulf Coast, the models had come into solid agreement, and forecasters blanketed much of the mid-Atlantic with blizzard and winter storm warnings for the next day. Many of the blizzard-warned areas were socked with at least a foot of wind-driven snow. The biggest letdown (for snow lovers, that is) was in the perpetually hard-to-call D.C. area, which ended up just beyond the sharp west edge of the precipitation shield.
These and other aspects of the storm remained shrouded in mystery till the end. Just as the location of a thunderstorm can’t be pinned down until it actually forms, models still can’t specify the exact arcs where snow bands will spiral around the main center of low pressure. That’s why New Jersey residents got a good deal more snow than they’d counted on—more than 30 inches (76 cm) in some spots—while parts of Long Island got a bit less than expected. Yet in both areas, people were promised a snowstorm they’d remember, and in both cases, it happened.
Between improvements in forecast technology and more nuanced communication, perhaps we’re nearing the point where no storm will come as a total surprise.