Acidification and more
Newly recognized threats to marine life emerge as Earth warms
Mar 1, 2011 - by Staff
Temporary impacts to NSF NCAR Road, Parking Lot and Trails
View more information.Mar 1, 2011 - by Staff
Bob Henson | 11 March 2011 • When climate change leaped into global consciousness more than 20 years ago, the focus—as one might expect—was on the atmosphere. There was no doubt that sea levels would rise, with the expansion of warming oceans accompanied by a growing cascade of melt water from ice sheets and glaciers. But the main worry among policymakers and the public was how those rising seas would affect civilization, not on how the oceans themselves might be transformed.
Today, a growing body of evidence points to a web of changes already under way in ocean temperature, circulation, and biogeochemistry. These changes pose an array of risks to marine life that’s prompted a surge of research.
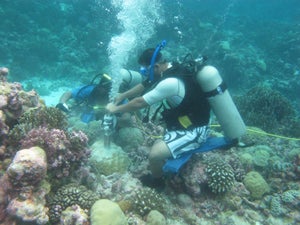
Collecting samples from a massive Porites coral in May 2010 are Aranteiti Tekiau and Toaea Beiateuea, researchers with the Kiribati Ministry of Fisheries and Marine Resources Development. The two are collaborating with Simon Donner (University of British Columbia) to assess the risk of coral bleaching across the central equatorial Pacific. (Photo courtesy Simon Donner.)
The best-known of the climate-related threats to ocean chemistry is acidification. The world’s oceans have soaked up roughly half a trillion tons of carbon dioxide, or about a third of all greenhouse gases produced by human activity since the Industrial Revolution. Because all that dissolved CO2 is weakly acidic, it’s been changing the pH balance of the oceans. On the logarithmic pH scale, the oceans—though still slightly alkaline—have moved toward acidity by about 0.1 point (roughly 30%).
It’s expected that future acidification could threaten a wide range of coral, shellfish, and other calcifying creatures. In 2009 Congress passed the Federal Ocean Acidification Research and Monitoring Act, and NOAA is now developing a strategic plan that will guide federal efforts to monitor and conserve marine life as pH values drop.
For those concerned about the fate of the sea and its residents, there’s another risk only recently recognized by scientists: widespread oxygen loss. Models now suggest that the amount of oxygen dissolved in Earth’s oceans could drop by anywhere from 1% to 7% by the year 2100, with much greater losses in some areas.
“This problem didn’t have a name a year and a half ago. It’s arisen only recently as a community-recognized concern,” says Ralph Keeling (Scripps Institution of Oceanography). He and a group of colleagues settled on the label “ocean deoxygenation” as Keeling began work on an overview of the topic that was published in 2010 by the Annual Review of Marine Science.
A review paper by Nicolas Gruber (ETH Zurich) soon to appear in Philosophical Transactions of the Royal Society sums up scientists’ new view of oceans with a succinct but ominous description: the seas are warming up, turning sour, and losing breath. “These three stressors will tend to affect the ocean at the same time, and in part, even synergistically,” says Gruber. “Once these changes have occurred, it will take centuries for the ocean to recover.”
Among the trio of concerns cited by Gruber, warming is in some ways the most straightforward. Since the 1950s, more than 80% of the heat trapped by human-produced greenhouse gases has gone into oceans. Much of it has accumulated in the well-mixed topmost layer of water. Global sea surface temperatures rose more than 1°F (0.6°C) in the last century, and they hit a record high in 2010.
Large amounts of heat are penetrating into colder, deeper layers as well, perhaps more than previously thought. NCAR’s Kevin Trenberth explored the challenge of tracking Earth’s global energy balance with a 2008 article in Current Opinion in Environmental Sustainability and a 2010 Perspectives essay for Science. Based on satellite and ground-based data on energy exchange over the last few years, Trenberth was surprised to find that roughly half of the energy entering the system since 2005 couldn’t be accounted for.
Upon further study, Trenberth and John Fasullo, an NCAR colleague and Science coauthor, discovered that a large part of the “missing” heat may be temporarily sequestered in waters below about 1,000 meters (3,300 feet), too far down to be adequately sampled by current instruments. “This reveals a glaring hole in our ability to observe the build-up of heat in our climate system,” says Fasullo. He and Trenberth are now working on detailed analyses for a forthcoming paper.
Adding heat to the ocean has far-reaching consequences for marine life. The most familiar and most dramatic among these is coral bleaching. It occurs when heat-stressed coral polyps expel the algae that both provide the coral with nourishment and secrete limestone to add to the reef (while also rewarding snorkelers and divers with spectacular color).
A commonly cited threshold for coral bleaching is when waters warm to about 1°C above their typical annual highs for at least a month. Such values can be generated over large parts of the tropics when a strong El Niño is in progress, and this heating is superimposed on the longer-term warming induced by climate change. Bleaching was so widespread during the record-setting 1997–98 El Niño that it became known as a “mass bleaching event.” The 2009–10 El Niño wasn’t quite as strong, but it triggered a comparable amount of damage—perhaps even more.
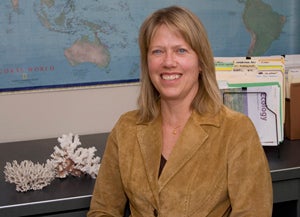
Joanie Kleypas (NCAR) is studying how coral adapt to rising ocean temperatures.
“When we finish adding up all the numbers, the coral bleaching of 2010 will probably be the most extensive in history,” says Simon Donner (University of British Columbia). Donner is among researchers trying to go beyond a single temperature threshold and identify the particulars that shape coral response by region.
Recent field and lab studies suggest that, in some areas, coral may be able to adapt to rising temperatures—for example, by pairing with algae that can handle the heat. NCAR’s Joan Kleypas, among the first scientists to study corals and climate change, is now looking at how adaptation might affect bleaching rates. With participants in the NCAR Advanced Study Program’s 2009 Summer Colloquium, Kleypas examined simulations from the NCAR Community Climate System Model (CCSM3) using a midrange emissions scenario. In a paper now in review, the group finds that bleaching rates would be negligible in those species that could adapt to at least 0.1°C (0.18°F) of warming per decade. If the corals couldn’t adapt, then bleaching would be expected at least every five years.
“These findings show how important it is to incorporate an accurate adaptation model in projections of future bleaching,” says Kleypas, “but it’s difficult to determine just how rapidly corals can realistically adapt to rising temperatures.”
The most vulnerable coral habitats may be those where oceanic heat spikes are rare but relatively strong. As part of an upcoming study in Ecological Applications, Donner analyzed both the seasonality and year-to-year variability of SSTs across coral regions. As a rule, temperatures in coral-supportive areas don’t change much from month to month or from year to year, but there are exceptions. Many higher-latitude reefs experience strong seasonality, for example.
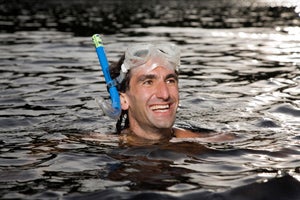
Simon Donner (University of British Columbia) has analyzed coral bleaching and studied it first hand.
Most intriguing to Donner is the case of the central equatorial Pacific. Here, there’s little month-to-month change in SSTs, but a given year can be substantially warmer than the previous one, thanks largely to the effects of El Niño—and in particular, El Niño Modoki, the recently identified subset of events in which equatorial warming is focused farther west than usual.
In 2005, Donner was preparing to head to a field project in Fiji when he heard that bleaching was under way in the central equatorial Pacific islands of Kiribati. He stopped off for an informal survey and has returned three times since, working with local colleagues to collect coral samples on a visit last year.
“As a result of seeing more of these central Pacific El Niños, the reefs in Kiribati are being hit with huge heat stress,” says Donner. However, he’s found less bleaching than expected, which led him to wonder whether the area’s naturally high year-to-year variability could have made the coral more resilient than those elsewhere.
Donner’s upcoming paper introduces a new bleaching prediction formula that takes interannual variations into account. The results look promising, he says, but more data are sorely needed in order to claim statistical significance. The primary global database on bleaching, called Reefbase, is a community-driven effort that leaves many coral habitats unsampled. “There are so many potentially unreported events,” Donner says.
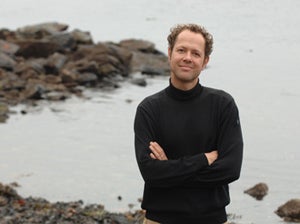
A team that included Boris Worm (Dalhousie University) found that significant drops in phytoplankton have occurred in many areas over the last century.
Another biological consequence of rising SSTs wasn’t fully recognized until last year. Sitting at the base of the oceanic food pyramid, phytoplankton make up roughly half of all the biomass generated on Earth. A team at Dalhousie University, led by graduate student Daniel Boyce, recently set out to quantify global trends in phytoplankton across the last century. The team’s results, published in Nature last July, were stunning: phytoplankton appear to have declined substantially across much of Earth’s ocean area.
“We’d been looking at changes at the top of the ocean food web—the decrease in large predators,” says Dalhousie marine ecologist Boris Worm, a coauthor on the Nature study. There wasn’t much data available further down the food web on plankton-eating fish or zooplankton, but the team was able to draw on a handy proxy for phytoplankton. Since the turn of the 20th century, the transparency of near-surface ocean waters has been measured using Secchi disks (see photo). These data can be converted into chlorophyll pigment concentrations (Chl), with results that are considered as solid as direct Chl measurements. In turn, Chl relates directly to phytoplankton biomass.
Boyce and colleagues combined data from Secchi disks with direct measurements to form a century-long Chl record that could be analyzed geographically. Out of ten regions defined by latitude and ocean basin, eight of the ten showed long-term declines, and Chl dropped at a linear rate of 1% of the global median value per year.
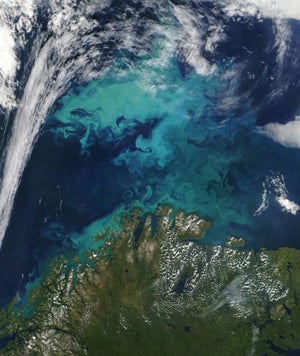
A huge phytoplankton bloom off the coast of Norway is evident in this image from NASA’s Moderate Resolution Imaging Spectroradiometer (MODIS), taken on 24 July 2004.
Within that trend, there were dramatic multiyear variations closely related to the El Niño/Southern Oscillation and the North Atlantic Oscillation. The variable most correlated with Chl decline, though, is rising SSTs. As the group put it in their Nature paper, the overall long-term drop in Chl is “unequivocal.”
Satellite data in recent years had hinted at a global decline in phytoplankton, so that result wasn’t a shock. However, “we didn’t expect such large declines,” says Worm. According to lead author Boyce, “Several researchers have appropriately been quite surprised at the magnitude of the decline that we reported, but overall the response has been encouraging.” He cautions that waters deeper than 20 meters (66 feet) and shallow coastal waters weren’t sampled: “Our analysis should not be considered a global phytoplankton budget and should not be interpreted as such, as it commonly has been.”
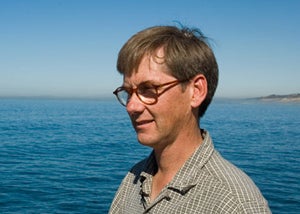
David Siegel (University of California, Santa Barbara) cowrote a News and Views article for Nature that accompanied Boyce’s study. “The thing that is startling about this paper, from my perspective, is the strong relationship between phytoplankton and the climate oscillators,” says Siegel. He adds that the century-long record compiled by Boyce and colleagues should support a wealth of future analysis: “This data set is very, very important.”
A critical factor in phytoplankton loss as well as deoxygenation (see below) may be the increasing stratification of ocean waters produced by long-term warming. With less mixing between layers, the biological pump that brings nutrients to the surface is inhibited. In ongoing work, the Dalhousie group hopes to get a better handle on the causes of the phytoplankton decline and how it might evolve. High-quality satellite data on ocean color have been collected only since the late 1990s, and the typical problems with satellite monitoring—including short lifespan and sensors that vary from one mission to the next—add to the challenge. A National Research Council panel is now studying how ocean color observations might best be supported and sustained.
Despite the downturn across the open ocean, there’s no shortage of phytoplankton in the well-publicized algal blooms that have formed in many coastal areas of the United States, Europe, and Asia. These erupt as nitrogen and phosphorus, mainly from large-scale agriculture, run off into the sea. As algae blossom, die off, and decompose in the nutrient-rich water, they pull huge amounts of oxygen from the sea, which starves other forms of marine life and leads to dead zones.
Ralph Keeling (Scripps Institution of Oceanography) is among the scientists working to bring attention to the risks of deoxygenation of the world's oceans.
These bursts of oxygen depletion close to shore have been documented and studied for decades. Since the late 1990s, ocean-atmosphere models have indicated that the ocean as a whole is also at risk of oxygen loss, in this case related to climate change. For starters, warmer oceans absorb less oxygen. However, an even bigger factor is the increasing stratification of those warming waters, which inhibits the mixing of near-surface oxygen to oxygen-poor lower levels.
In his 2010 review paper, Keeling and colleagues summarize the evidence for recent ocean deoxygenation. “The studies cover different time frames and regions, making a global synthesis difficult,” they note. Still, there’s evidence for oxygen depletion in several key areas, including the North Pacific, where much of the ocean at middle depths is hypoxic for many creatures (too low in oxygen to support life). At one North Pacific location, the top of the low-oxygen layer has risen from 400 to 300 meters in depth (1,300 to 1,000 feet) since the 1950s.
Even small changes in oxygen content could push some species beyond critical thresholds, says Keeling. “You’ll have winners and losers. Some fish would migrate higher in the water column, but there are bottom fisheries that would experience detrimental impacts.”
Since deep waters will take a thousand or more years to adjust to global warming, oxygen loss is a classic long-term threat. Some simulations show as much as a 30% decline in global oceanic oxygen over coming centuries, with corresponding expansion of low-oxygen zones. However, says Keeling, all of these model results should be taken with a grain of sea salt. Currently, much of the oceanic uptake of oxygen happens in relatively small areas that are difficult to simulate using today’s relatively coarse ocean models.
One example is the far northwest Pacific, where outbreaks of Siberian air roil the ocean in winter and transfer large amounts of oxygen downward. Zones like these point to regional vulnerabilities, says Keeling. “It’s not like there’s a vigorous oxygen supply to the subsurface Pacific. It’s already pretty haphazard.”
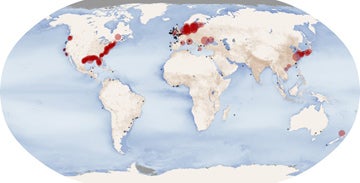
While deoxygenation related to climate change is a looming threat to the world’s seas, many parts of the ocean close to populated areas have already seen dead zones, believed to be caused mainly by runoff from chemical fertilizers. In this NASA-produced map, red circles show the locations and sizes of many of our planet’s dead zones, areas where dissolved oxygen in deep water is too sparse to support life. Black dots show where dead zones of unknown sizes have been observed. The related NASA site includes more details and a larger version of the image. (Illustration courtesy NASA Earth Observatory.)
Along with more sophisticated models, observations could also be improved. The advent of the global Argo array—more than 3,000 buoys placed across the world’s oceans over the last decade, which sample at levels down to 2,000 meters (6,600 feet)—could allow for enhanced measurement of oxygen, phytoplankton, and other ecosystem components. If only a few hundred Argo floats were equipped with oxygen sensors, notes Keeling, more than half a million high-quality oxygen measurements could be gathered in a single year. Periodic large-scale sampling from the Climate Variability and Predictability (CLIVAR) program’s Repeat Hydrography Program may also help.
For now, Keeling is happy to see ocean deoxygenation taking its rightful place among the manifold threats posed by climate change to global seas. He hopes the topic will be taken up in more depth with the next assessment report of the Intergovernmental Panel on Climate Change. “It’s quite interesting from a raw science perspective,” he says, “and it’s a great motivator to encourage better observations and better modeling.”