A cloud to remember—and a mystery to solve
Mar 30, 2011 - by Staff
Temporary impacts to NSF NCAR Road, Parking Lot and Trails
View more information.Mar 30, 2011 - by Staff
Margaret LeMone | 30 March 2011 • Walking out of the NCAR Foothills Lab last Wednesday, 23 March, at 3:15 p.m. MDT, I was stopped in my tracks by an incredible sky: a high, very thin layer of small, uniform, tiny cloudlets. Since each of the cloudlets was less than a degree wide and unshaded, the cloud formation fits the World Meteorological Organization definition of cirrocumulus. But was it?
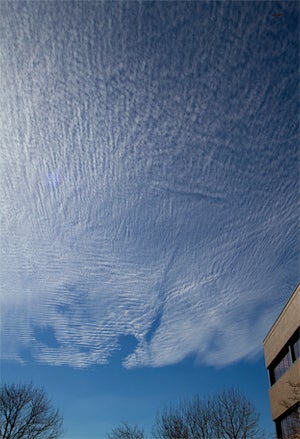
This mysterious cloud was photographed by Carlye Calvin looking west (upwind) from UCAR’s Foothills Lab 4 building.
To the southwest, smoke from a fire to the west of Golden was marked by a wavy structure in the air at lower levels, which often happens here in Colorado. Jets flying overhead left intermittent contrails west of the cloud edge, as well as paths of clear sky in the cloud layer called “distrails” (these are also called “canals” at a later point in their evolution). There were even a few fair-weather cumulus clouds, forerunners of more spring-like weather. All in one sky! What caused all of this?
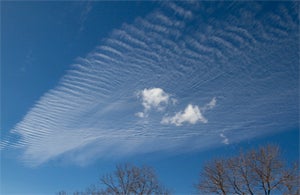
The picture at right shows more of the main cloud formation, including the spectacular fine-scale texture of the cloudlets.
Notice how small the cloudlets are. As noted above, this cloud fits the WMO definition of “cirrocumulus,” which are typically made up of ice crystals (sometimes by supercooled water droplets). Consistent with this, two experienced observers noticed no iridescence. Iridescence is the coloring of clouds close to the Sun due to diffraction of sunlight by water droplets of uniform size, a common phenomenon here in Colorado. The lack of iridescence suggests a relatively cold, high-altitude cloud. Or it could be that the cloud is lower (altocumulus instead of cirrocumulus), but with water droplets that are not of uniform size.
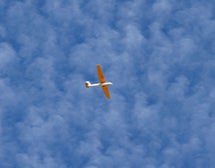
Also supporting the idea of these clouds being cirrocumulus is the thin, ice-like appearance of some of the cloudlets, as in this shot, looking almost directly overhead as a glider passes over Boulder. Altocumulus elements would typically be thicker.
There has been vigorous debate among some of my peers on whether the clouds were in fact cirrocumulus or altocumulus. How might we find out?
To learn more about the cloud layer and the conditions leading up to its formation, let’s examine the Denver sounding (below), collected by a balloon-borne rawinsonde (instrument package) that was launched at around 6:00 p.m. local time, about two hours and 30 minutes after the formations were photographed. (For more detail on how to read a sounding, see this website from Millersville University.)
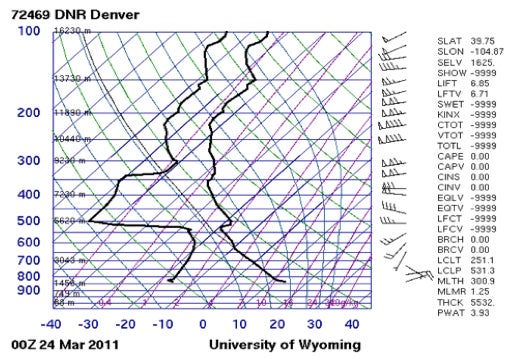
A sounding launched from Denver shows upper-level conditions at 00Z 24 March (6:00 p.m. on 23 March). (Courtesy University of Wyoming.)
Wind speed and direction are shown at far right by the feathered arrow symbols. Each arrow shows the horizontal wind at a given height as if one were looking down from above, with the arrow pointing into the wind. Each triangle-shaped feather indicates 50 knots of wind (about 57 mph), and each full line is 10 knots (about 11.5 mph). You can see that winds at lower levels were fairly light from the east, swinging around to south as you go up and then strongly from the west at higher levels. The top speed is 130 knots (about 150 mph) at a height of about 10 kilometers (6 miles) above sea level. As we’ll see, the high winds at higher levels may be an important clue to the origin of our mystery cloud. But we also need to determine where humidity is high enough to allow clouds to form.
Temperature is shown by the rightmost of the two thick black lines that run up and down the chart. To find the temperature at a given height, follow the nearest blue line downward and leftward until it reaches the legend at bottom (from –40°C to +40°C) and interpolate between the blue lines as needed. You can see that the surface temperature (bottom of the black line) on this mild March afternoon is 14°C, or about 57°F. However, the readings drop off very quickly with height. Boulder’s elevation is close to 1,600 meters (5,400 feet), but at about 3000 meters (10,000 feet), temperatures are near 0°C (32°F).
The leftmost of the two thick black lines shows dewpoint, a measure of how much water vapor is in the air. The relative humidity can be estimated at a glance by looking at the distance between the temperature and dewpoint lines at a given pressure level, which corresponds roughly with height. (Horizontal lines are labeled in millibars or hectopascals (hPa) in blue, with the corresponding heights shown in black). Where the thick lines come close together, as is the case between 600 and 540 hPa, the relative humidity is higher; where the lines are far apart, as at 500 hPa, the relative humidity is lower.
With all this in mind, we can see the relative humidity rising as we move from the surface (about 840 hPa) up to 600 hPa. Higher up, there is a dry layer between 500 and 340 hPa and a moist layer between 330 and 300 hPa. Because clouds form as a result of rising motion in moist air, the two most probable locations for our mystery cloud are near the tops of these two moist layers: around 5000 meters (16,400 feet), which would correspond to altocumulus, or around 9000 meters (30,000 feet), which would signify cirrocumulus. So the mystery is not yet solved!
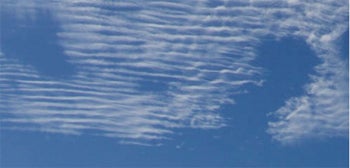
Ripples were visible at the upstream edge of the cloud formation, looking west. (Photo by Carlye Calvin.)
The clouds themselves—the way they moved and evolved—provide conflicting evidence as to their height.
In-person observations reveal that the cloudlets were moving rapidly eastward. Two experienced observers, UCAR’s Robert Henson and NOAA’s Tom Schlatter, estimated that the cloudlets were moving at speeds of greater than 80 mph. The strong winds shown on the sounding at the higher moist layer (around 110 knots or 127 mph) are consistent with this.
However, the microphysics evidence seems to tell another story. The upwind side of the cloud, shown below, looks as if the cloud was made of water droplets rather than ice crystals. Water droplets would be difficult (though not impossible) to sustain in the higher moist layer, given its very cold temperature of around –40°C (–40°F).
Notice also the patchy holes. Such structures, according to NCAR’s Andrew Heymsfield (see his 2010 article in the Bulletin of the American Meteorological Society), are associated with temperatures of the order of –20°C (–4°F). This corresponds to the temperature at the top of the lower moist layer.
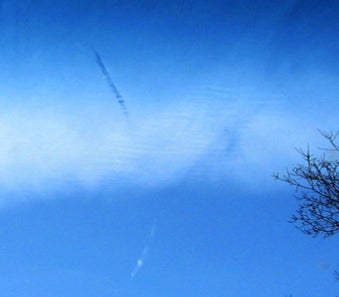
Looking west, a curved contrail was produced by a westward-flying jet (top to bottom of image). (Photo by Peggy LeMone.)
Contrails are yet another fascinating piece of this puzzle. The contrail shown at left, photographed at 3:15 p.m. MDT through a car windshield, shows the path of a jet aircraft first as a dark line in the top left of the photograph, as the jet moves westward (downward); next, an area where the contrail is not visible; and then, just below the cloud edge in the picture, a place where the contrail evaporated, and finally a visible contrail indicating the aircraft turned toward the left.
According to Heymsfield, contrails don’t normally form unless the air temperature is below –30°C (–22°F). When I took this picture, I interpreted the dark line as another distrail forming. Unless the aircraft climbed very steeply, the –30°C reading would put the cloud at the –40°C level. An alternative explanation would be that the dark line is the shadow cast onto the main cloud by sunlight hitting the contrail from above, with no shadow next to the cloud edge because the contrail had evaporated at that point.
There is no “smoking gun” to solve our atmospheric mystery, but there are a couple of final clues related to the advent of springlike weather in Boulder: gliders and fair-weather cumulus.
A glider sails beneath the deck of cloudlets. (Photo by Carlye Calvin.)
As the main cloud feature swept over Boulder, a glider circled beneath it (see photo at right), riding atop thermals of warm air that rose from the ground. How deep did those thermals extend? We can tell from the sounding how deep they were near Denver about two hours later. The temperature decreasing at a steady rate is consistent with a well-mixed layer; we know that the mixing is due to thermals. And, if we didn’t know the glider was riding thermals, there is an additional clue in the photo below: the fragments of cumulus shown in the photo below. These clouds form when the air in the thermals is high enough (cool enough) to produce condensation in the form of cloud droplets.
How high would the cumulus be? The air in the thermal feeding the cloud would tend to have steadily rising humidity and a temperature steadily falling at a rate of about 9.8°C per kilometer (23.8°F per mile). If we extrapolate the converging temperature-and-dewpoint lines in the sounding to where the temperature equals the dew point, this would suggest the cloud is at about 550 hPa—only 10-20 hPa below the top of the lowest moist layer.
If both the cumulus and the main cloud formed in the lower layer, you would expect to see some visible evidence of cloud interaction. Moreover, the cumulus looks much closer than the main cloud does. This suggests that the main cloud is indeed located in the higher moist layer.
A few cumulus fragments lie beneath the main cloud deck. The cumulus appear to be at a considerably lower height. (Photo by Peggy LeMone.)
As of this writing, we still do not know for certain the height of this beautiful and fascinating cloud. Among the pieces of evidence for the higher option (cirrocumulus): size of cloudlets, lack of shadow, lack of iridescence, better match of the estimated speed of the cloudlets with the sounding, and the closeness of the estimated height of the cumulus to the lower moist layer. However, the temperature of –40°C in the higher moist layer seems too cold from a microphysical point of view.
In order to resolve this issue, we sought extra evidence of cloud height from NOAA’s National Environmental Satellite, Data, and Information Service (NESDIS), who forwarded this question to the University of Wisconsin–Madison. Unfortunately, the cloud was too thin to make a definitive ruling as to cloud height, and the experimental CloudSat satellite was not overhead while the cloud was there. We are trying to find out whether we can resolve the issue through pilot reports.
We aren’t the only ones who have pondered questions like this. In a classic Peanuts comic strip from the 1960s, Linus and Sally are gazing up at the sky, and Sally asks, “How high are the clouds, Linus?” He replies, “Oh, they’re at different heights. Some of them are ‘far-away high’ and some of them are ‘right-up-there high’.” When Charlie Brown arrives and says, “What sort of explanation is that?”, Linus replies, “Sometimes it’s best to keep these things in the language of the layman.”
What do you think: “far-away high” or “right-up-there high”?
Update - 26 May 2011 | A cloud to remember, Part 2—Mystery solved?
This article involved input from numerous individuals, including Andy Heymsfield, Charles Knight, Carlye Calvin, and Bob Henson (NCAR); Scott Bachmeier and James LaDue (NOAA/NWS Warning Decision Training Branch); Daphne LaDue (Center for Analysis and Prediction of Storms); Daniel Lindsay (Cooperative Institute for Meteorological Satellite Studies); and Tom Schlatter (NOAA Earth System Research Laboratory). Credit also goes to the late Charles Schultz, creator of Peanuts.
>>>
Margaret "Peggy" LeMone spends much of her free time exploring ways to investigate the world of weather as a citizen scientist. An NCAR senior scientist emerita, she served as the 2010 president of the American Meteorological Society.