Aviation safety: New computer tool forecasts icing hazards
Apr 12, 2011 - by Staff
Apr 12, 2011 - by Staff
BOULDER—Aircraft safety is getting a boost from a new computer-generated forecast that provides pilots with critical weather information on the likelihood of encountering dangerous in-flight icing conditions.
Each year in the United States, 20-40 aircraft accidents are linked to in-flight icing encounters. Icing conditions, created by water droplets from clouds that freeze on the surface of an aircraft, can affect air travel anywhere, especially during colder months. Hazardous icing conditions cost the U.S. aviation industry an estimated $20 million annually in injuries, aircraft damage, and fuel.

Icing buildup on the wing of a small aircraft. (©UCAR. This image is freely available for media use. For more information, see Media & nonprofit use.*)
The Forecast Icing Product with Severity, or FIP-Severity, provides 12-hour icing forecasts that are updated hourly for pilots, air traffic controllers, and other users of aviation weather information who plan their flight paths over the continental United States. It was developed by researchers at the National Center for Atmospheric Research (NCAR), with funding from the Federal Aviation Administration.
“In-flight icing can create extremely dangerous conditions for pilots,” says NCAR scientist Marcia Politovich, who leads in-flight icing research at NCAR. “Recognizing the potential for icing conditions to develop over time and the degree of severity are both crucial for safe flight planning.”
FIP-Severity will most benefit commuter planes and small aircraft, says Politovich. Such aircraft are more vulnerable to icing hazards because they cruise at lower, ice-prone altitudes, below 24,000 feet. They also may lack mechanisms common on larger jets that prevent ice buildup, such as heated wing edges.
In January, the Aviation Digital Data Service began displaying icing products generated by the FIP-Severity program. ADDS, which operates out of the National Weather Service’s Aviation Weather Center in Kansas City, provides digital and graphical weather forecasts, analysis, and observations to the aviation community.
FIP-Severity is a computer-based forecast of the probability of icing based on an analysis of temperature and humidity data associated with clouds, which are the source of in-flight icing. The automated algorithm gathers real-time information from satellites, radars, weather models, surface stations, and pilot reports, and determines the probability of encountering icing, its expected severity, and the likelihood of large droplet icing conditions.

Marcia Politovich (©UCAR. This image is freely available for media use. For more information, see Media & nonprofit use.*)
This capability is an update to NCAR’s original Forecast Icing Product (FIP), which has been in operation for several years but only calculated an uncalibrated icing “potential.” The Current Icing Product (CIP) depicts severity and probability of an encounter with icing, but only for current conditions. Requests from users for more detailed information led to the development of FIP-Severity.
"This tool improves users' abilities to map flight paths across the country with safety and efficiency in mind,” says Politovich.
Icing conditions require supercooled liquid water drops—cloud drops, drizzle, or rain that exist at temperatures lower than 32°F (0°C).
In-flight icing occurs when water droplets from clouds freeze on the surface of an aircraft. “Supercooled” large drops with diameters greater than 50 microns are particularly dangerous because they rapidly impede an airplane’s aerodynamics. Icing can increase drag and decrease lift, ultimately causing the pilot to lose control of the aircraft.
Both local- and regional-scale weather patterns, particularly air rising over frontal systems or mountain ranges, play a role in creating icing conditions. “We often see warm or cold fronts, low pressure systems, and rising convective air masses associated with icing encounters,” Politovich says.
Commercial jets generally fly above 29,000 feet, much higher than typical icing altitudes, and are equipped with de-icing systems. Even with these systems, however, commercial pilots prefer to avoid icing risks. Adding severity information to FIP assists pilots in safe and efficient route planning around potential hazards.
The FIP-Severity computer software incorporates measurements of temperature at the tops of clouds, humidity levels in vertical columns in the atmosphere, and other atmospheric variables. It then employs a “fuzzy logic” algorithm, somewhat similar to the human thought process, to identify cloud types and the likelihood of precipitation aloft.
“Fuzzy logic helps us analyze and discern among information that can sometimes conflict so we can more accurately identify those clouds that present an especially high risk of icing,” Politovich says. “The program weighs each factor associated with icing, and once all the data have been examined, it provides a probability and severity forecast.”
A study in 2004 by the U.S. National Transportation Safety Board found that in-flight icing was responsible for dozens of accidents a year, mostly among smaller, general aviation aircraft. An estimated 819 people died in accidents related to in-flight icing from 1982 to 2000, with most accidents occurring between the months of October and March, according to the study.
This research is in response to requirements and funding by the Federal Aviation Administration (FAA). The views expressed are those of the authors and do not necessarily represent the official policy or position of the FAA.

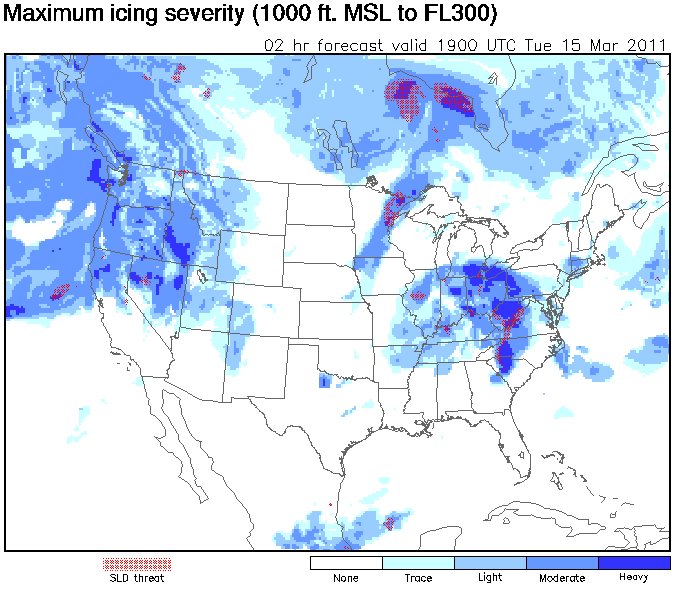
This graphic display from the FIP-Severity software program depicts a 2-hour icing severity forecast across the United States on March 15, 2011. The forecast is for a column extending from 1,000 to 30,000 feet above mean sea level. The shades of blue denote the level of severity, with dark blue indicating heavy icing. The red areas of "SLD threat" are warnings for the presence of supercooled large drops, an indicator of severe icing potential. Icing can create a significant hazard for some types of aircraft. (Image courtesy NOAA/NWS/ADDS.)
Current Icing Product on ADDS (provided by NOAA's National Weather Service)
ADDS Experimental Site from NCAR & FAA
In-flight Icing Research at NCAR