Recipe for calamity: The ingredients of a horrific tornado outbreak
Apr 28, 2011 - by Staff
Temporary impacts to NSF NCAR Road, Parking Lot and Trails
View more information.Apr 28, 2011 - by Staff
Bob Henson | 28 April 2011 • The devastating rash of tornadoes that swept through the southeast United States on 27 April has already carved its way into the annals of twister history. A total of more than 160 tornadoes was reported in the preliminary count released by the NOAA Storm Prediction Center for the 24-hour period from 7:00 AM CDT 27 April to 28 April. That total will drop over time, as duplicate reports are filtered out, but it should still rank among the top one-day totals on record. And more than 200 people were killed—the worst U.S. death toll from tornadoes since the Super Outbreak of 3–4 April 1974, which remains the most prolific producer in tornado history.
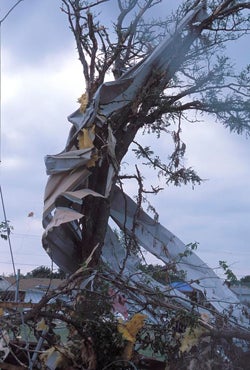
Moore, Oklahoma, was hit by a violent tornado on 3 May 1999, then pummeled by a second twister on 8 May 2003, which produced the damage above. (Digital Image Library photo © UCAR.)
How could such a disaster happen in 2011? A number of factors—meteorological, geographical, and sociological—came together in a rare and deadly way.
Hours before the tornadoes began in earnest, forecasters were deeply concerned about the day’s potential for trouble. The classic elements of tornado production were in place across a huge area:
Often a fast-moving front will generate a solid line of intense thunderstorms but few or no tornadoes. However, on 27 April, the configuration of winds and the large zone of instability meant that thunderstorms could easily develop or move east of the cold front while retaining their tornadic potential.
Forecasters often use “composite indices” that blend the above ingredients to see where the highest tornado risk might emerge. These have been developed by NOAA and university researchers as well as by several private firms, including The Weather Channel, which employs the TOR:CON index.
Given that several of the tornado ingredients were unusually strong on 27 April, the composite indices were jaw-droppingly high, and the official outlooks reflected that. At 1:10 a.m. CDT, more than 12 hours before the outbreak hit full force, NOAA’s Storm Prediction Center placed northern Alabama and parts of adjoining states under a “high risk”—its highest threat level—and noted the potential for strong, long-lived tornadoes. Tornado watches issued by early afternoon labeled the setup a “particularly dangerous situation.” Forecasters underlined the threat even further in regular weather discussions issued by National Weather Service offices. An NWS meteorologist in Jackson, Mississippi, warned in a late-morning discussion: “I can’t stress enough how dangerous this situation appears.”
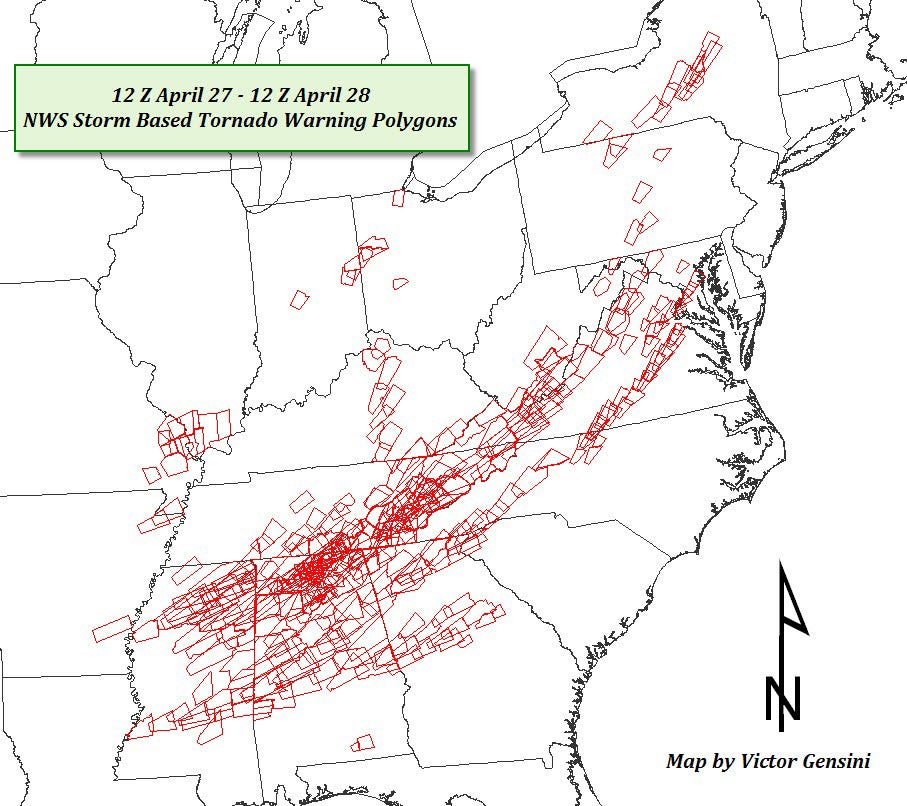
A swath from southeast Arkansas to New York was plastered with tornado warnings on 27–28 April 2011, as shown in this graphic. Each polygon represents one warning issued for an observed or Doppler-indicated tornado. The polygons are converted into counties when warnings are communicated to the public. Click here for an enlarged version. (Graphic courtesy Victor Gensini, University of Georgia.)
Once the storms got cooking, the NWS issued warnings that were both timely and strongly worded. Local weathercasters, such as pioneering weather blogger James Spann at Birmingham’s ABC 33/40, also provided exhaustive coverage. But as the day’s events showed, excellent warnings aren’t enough to prevent a large death toll—even in 2011. What happened?
Some mobile home parks are now providing shelters, either to meet state requirements (as in Minnesota) or through grants and other initiatives (as in this Wisconsin example). However, many states have no such requirements, and many thousands of people across the South live in single mobile homes on small acreages. As a group, mobile home residents tend to have little lobbying clout, and there’s no sign of any push for national requirements—so, unfortunately, we may continue to see high tornado death tolls among mobile home residents.
Of course, many free-standing structures were also demolished by the 27 April tornadoes. In moderately strong tornadoes, people often survive by clustering in a hallway or closet (sometimes the only parts of a building that survive). However, a tornado rated EF5 on the Enhanced Fujita Tornado Damage Scale—with wind gusts exceeding 200 mph—can sweep a home off its foundation, leaving no margin of safety short of a basement.
One of the big questions to be addressed in post-storm analysis is how many of the day’s deaths were essentially unavoidable and how many might have been averted. U.S. tornado deaths dropped dramatically from the 1920s through the end of the 20th century when adjusted for population, according to this analysis by Harold Brooks (National Severe Storms Laboratory). However, as shown on the graph below, the improvement seemed to level off after about 2000. The fatalities from 27 April 2011—as well as the 45 other deaths observed this year up to 26 April—will only add to this effect. It remains unclear why this is happening and whether it'll become a longer-term trend.
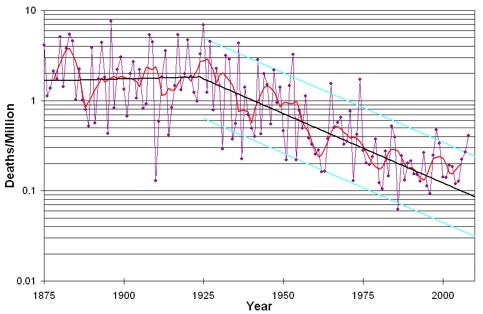
The number of U.S. tornado deaths per million residents declined steadily through the latter part of the 20th century, but has apparently leveled off since then. (Image courtesy Harold Brooks and NOAA Weather Partners.)
Key mysteries remain in how tornadoes and tornadic thunderstorms evolve, and some answers may emerge from analyses of data gathered in the exhaustive VORTEX2 project from 2009–10. One thing is unlikely to change, however. “When you have violent, huge tornadoes moving through urban areas, they will cause casualties,” notes tornado forecaster Roger Edwards. In some initial thoughts posted on his “Weather or Not” blog, Edwards muses: “Perhaps the main emphasis of study of this event should be more from a preparedness and societal angle than atmospheric (though I’m sure there are new aspects to learn and papers to be written meteorologically also).” Edwards' post also includes links to several of the most impressive videos from this major outbreak.
In 2005, New Orleans was known to be at high risk of a hurricane catastrophe. Yet it had been many years since a hurricane had killed more than 100 Americans, which added to the shock of Katrina’s death toll. No matter what the weather threat, even the best warnings conveyed through omnipresent media aren’t enough to prevent disaster when people don’t, or can’t, get themselves to safety.
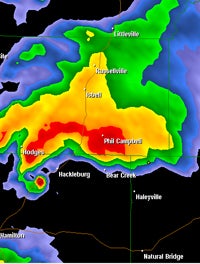
Doppler radar based north of Mississippi’s Columbus Air Force Base tracked this thunderstorm as it raged across northwest Alabama on 27 April 2011 at 3:24 PM CDT, when a tornado was approaching the town of Hackleburg. Intense red echoes show rain and hail arcing around the storm’s rotating west end, with a “debris ball” visible as a red blob separated from the main storm echo. The debris ball is produced by radar signals bouncing off objects lofted by the twister. (NWS radar image courtesy Cody Kirkpatrick, UCAR/COMET.)
The 27 April tornado disaster hit home both professionally and personally for Cody Kirkpatrick, a postdoctoral fellow in UCAR’s COMET Program.
Kirkpatrick grew up in the town of Hamilton in northern Alabama. Hamilton came through more or less unscathed, but the nearby town of Hackleburg was devastated. At least 19 people died, and one of the town’s largest employers, a jeans distribution center, was demolished. The high school that Kirkpatrick attended in Hackleburg suffered major damage.
“The radar presentation of this storm was extraordinary,” says Kirkpatrick. Even before it hit Hackleburg, the tornado sported a “debris ball” on radar (see graphic at left) that grew in intensity over time. Doppler radar data also showed that tornadic winds near the base of the thunderstorm varied by 204 knots (235 mph) across a distance of only about 1.1 kilometer (0.7 mile).
According to Kirkpatrick, “This was one of those days with so many extreme events, and even taking all the textbook precautions was not enough. The only safe place was, well, not in the path of the storm!”