A cloud to remember, Part 2—Mystery solved?
May 20, 2011 - by Staff
Temporary impacts to NSF NCAR Road, Parking Lot and Trails
View more information.May 20, 2011 - by Staff
Margaret LeMone | 26 May 2011 • The email exchange in response to my 30 March post revealed not only the enthusiasm of the Boulder weather community for clouds but also the presence of a large number of instruments probing the atmosphere over Boulder—and, in the end, the height of the formation. The analysis below was prepared in substantial collaboration with Thomas Schlatter (NOAA Earth System Research Laboratory) and with input from many others (see acknowledgments at bottom).
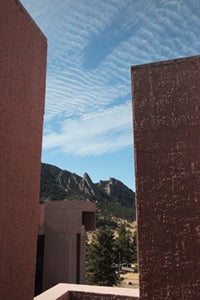
The "mystery cloud" of 23 March 2011 as seen from NCAR's Mesa Laboratory. (Photo by Brian Bevirt.)
Here’s a one-paragraph summary of my earlier post:
There was a spectacular cloud formation over Boulder between 3:00 and 4:00 p.m. MDT on 23 March. Many lay and professional observers/scientists identified it as cirrocumulus, based on the World Meteorological Organization’s definition (small cloudlets that span less than a 1-degree angle in the sky and that are too thin to produce shadowed bases). Another factor pointing toward a high-altitude location was that the cloudlets were moving rapidly eastward. The Denver sounding at 6:00 p.m. MDT (see explanation of soundings from the University of British Columbia) showed two moist layers: one at about 5,000 meters (16,400 feet above mean sea level, or MSL) with winds out of the southwest to west at 25–30 knots (29–35 mph), and one at 9,000 m (30,000 feet MSL) with west winds at more than 100 knots (115 mph). The strong winds and moist layer at high altitudes led us to conclude that the cloud layer was at 30,000 feet. Also, cumulus observed near the top of the lower moist layer seemed to be far below the cloud layer. However, several cloud physicists were skeptical, noting the development of holes in the cloud formation that were consistent with glaciation and ice-particle fallout. These processes would correspond with temperatures around –20°C (–4°F) rather than the –40°C (–40°F) recorded at 30,000 feet.
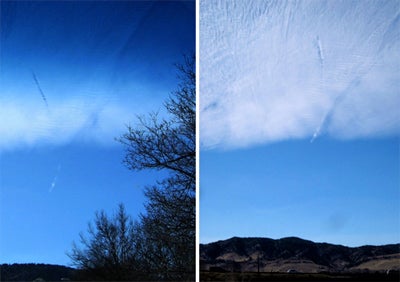
Pictures of the mystery cloud taken at (left) around 3:30 p.m. MDT from 1/8 mile east of the intersection of Iris Avenue and Hermosa Drive (1.22 mi west of NCAR’s Foothills Lab) and (right) at 3:24 p.m. MDT from NCAR’s Foothills Lab (3450 Mitchell Lane). The Iris picture was taken from a moving car and has been cropped and darkened slightly to highlight the cloud edge; the blue tint at top was produced by the windshield. The diagonal blue line segment on the left side of the left picture and just to the right of the center of the right picture is thought to be a “distrail,” formed when penetration of a jet aircraft destroys the cloud locally. (Left photo by Peggy LeMone; right photo courtesy of Sam Hall, NCAR.)
Fortuitously, NCAR’s Sam Hall (NESL/ACD) photographed the cloud formation at nearly the same time I did. We were separated by about 1.9 kilometers (1.2 miles), affording the opportunity to determine the cloud height by the time-tested technique of photogrammetry. (See photos at left.)
After careful measurements to determine the horizon, and multiple refinements of the location of my photograph, which was taken from a moving car, we arrived at a cloud height of about 2 mi (3.2 km) above ground level (AGL), or about 16,000 ft MSL. (See diagram below.)
If one assumes that the pictures were taken at exactly the same time, the “low” height would be consistent with seeing more hints of a contrail from the western location – that is, if the aircraft producing the contrail is much higher than the cloud. This interpretation would mean that the apparent distrail visible in the photos was in fact a shadow. (A distrail is a clear line segment within a cloud believed to be produced by heat from aircraft exhaust, perhaps with contributions from freezing of supercooled water and/or mixing induced by the aircraft.)
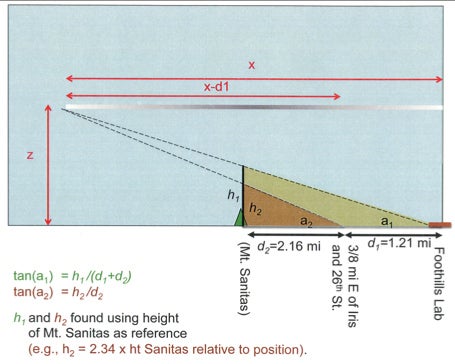
Diagram showing how the height of the cloud was determined using its western edge as a reference. Note that the cloud height is the height at which the two dashed lines intersect.
While the microphysicists welcomed this result, the cloud observers were skeptical. And the distrail in the picture doesn’t really look like a cloud shadow.
Tom Schlatter and I joined forces in an effort to find profiling measurements that might isolate the height of the cloud base. Our results provided more and more confidence in the “high” verdict.
Tom’s colleague Doug van de Kamp provided us with measurements from the NOAA Platteville Wind Profiler, which is located 50 km (31 mi) northeast of Boulder. These data (see graphic below) showed an increasing amount of turbulence at the right time and height to correspond with the presence of the cloud (after 3:00 p.m. MDT and near 9 km or 30,000 feet MSL).
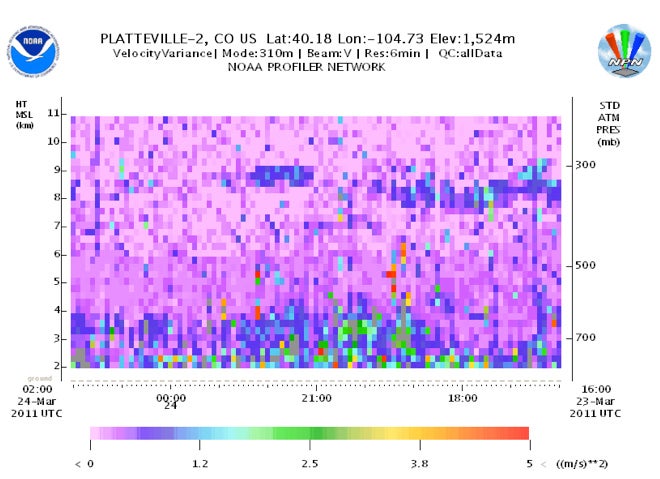
This plot from a NOAA wind profiler near Platteville, Colorado, shows vertical velocity variance, an indicator of turbulence. Time goes right to left. Note the elevated turbulence layer, located near 9 km above mean sea level, that occurs between about 2100 and 2230 UTC (3:00–3:30 p.m. MDT). (Courtesy of Doug van de Kamp, NOAA.)
But could the turbulence be simply a result of large wind shear? Two more sets of measurements reduced any doubt. Randolph “Stick” Ware (Radiometrics) sent us data from an upward-looking infrared thermometer installed at his facility. These observations had a signature consistent with high clouds going overhead at the right time (see below).
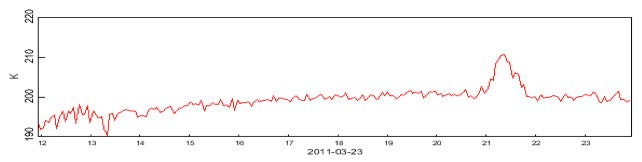
Infrared temperature as a function of time (UTC) from an upward-looking Heimann KT15.85 (9.6-11.5 micron) sensor at Radiometrics, located four miles northeast of the NCAR Foothills Lab. The small temperature rise around 2100–2200 UTC (3:00–3:30 p.m. MDT) is consistent with a high, thin cloud overhead. (Courtesy of Randolph Ware, Radiometrics.)
The third piece of evidence comes from the University of Colorado Skywatch Observatory ceilometer, located on the CU–Boulder campus about 4 km (2.5 mi) southwest of Foothills Lab. The graph below shows a cloud at around 7,250 meters (24,000 feet) AGL between 2100 and 2200 UTC (3:00–4:00 p.m. MDT).
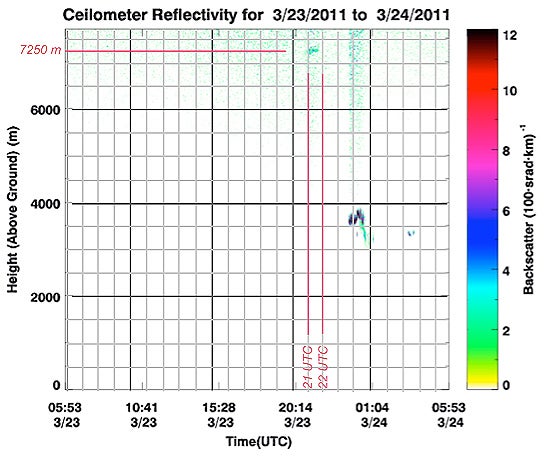
Cloud base from the Vaisala CL31 ceilometer at the NSF-sponsored Skywatch Observatory at the University of Colorado Boulder. Time increases left to right. Time labels refer to tick marks; grid lines are shown for each even hour. (Courtesy Alan Scott Kittleman, CU-Boulder.)
Dan Wolfe (NOAA) looked at the data from the NOAA Boulder Atmospheric Observatory tower in Erie, Colorado, about 20 km (13 mi) east of Foothills Lab. He reported that two of the hourly cloud photos looking west showed the cloud, which also caused a depression in the incoming solar radiation at the right time. A collocated ceilometer sensitive to clouds with bases at or below 7 km showed no cloud base. All of this was evidence that the mystery cloud’s base was above 7 km (23,000 ft) AGL.
All of the observations point toward a cloud height far higher than estimated via photogrammetry. What could have gone wrong?
I thought that photogrammetry, even with rather approximate measurements, would be good enough to capture cloud height to within a factor of two. As my associates questioned my conclusions, though, I realized that my calculations were fraught with uncertainties. One of those, pointed out by Tom Schlatter, was that my reference point—the western edge of the cloud—was not necessarily stationary. Time-lapse video of the cloud, looking west from NCAR’s Foothills Lab, reveals a shift in the cloud’s western edge, but not enough to explain the height underestimate. By playing with the contrast of the Iris photo onscreen, I could discern that the western edge of the cloud was actually farther west than I had previously thought.
A second pitfall was in correlating the horizons on the two photos. Because Boulder lies so close to the mountains, the actual height of the western horizon depends greatly on your location in town. For the Iris picture, I had determined the horizon by locating the point where the sides of Iris, a straight road, converged to a point. However, I had wrongly neglected the road’s gradual westward rise. I also found in retrospect that I had used the wrong peak west of Boulder in estimating the height of Mt. Sanitas on the picture. (The apparent height of the cloud edge was estimated as a fraction of the height of Mt. Sanitas relative to the horizon).
Putting these adjustments into the photogrammetry diagram yields a cloud height of the order of 6.4 km (21,000 feet) AGL. Given the uncertainties in the measurements involved, this is consistent with the other evidence presented above. However, it’s important to note that I made these adjustments with the knowledge that the other evidence pointed toward a high cloud.
In this instance, at least, the cloud watchers had it right: the spectacular cloud formation over Boulder between 3:00 and 4:30 pm MDT on 23 March 2011 was indeed cirrocumulus. Its evolution and appearance were consistent with the presence of water droplets glaciating and falling out, as described in a 2010 article by NCAR’s Andrew Heymsfield and colleagues published in the Bulletin of the American Meteorological Society and highlighted in UCAR Magazine.
The fact that this behavior occurred at temperatures barely above –40°C (–40°F) is surprising. When air is this cold, ice crystals can develop directly from water vapor, and it is very rare to find liquid droplets. The microphysical aspects of this cloud deserve further study.
Whatever we end up learning, those of us who were lucky enough to see this cloud will remember it for its own sake. As Tom Schlatter puts it, “The event itself was strikingly beautiful.”
Acknowledgments
Tom Schlatter actively participated in the development of this post, and deserves to be co-author. In addition to the many people mentioned, others should be thanked for the referrals that eventually bore fruit, including Julie Lundquist (CU-Boulder), who pointed us to the Skywatch data at CU, and from NCAR, Jielun Sun, who noted that Stick Ware was measuring continuous profiles from Radiometrics; Beth Holland, who put us into contact with the soaring community; and Marcia Politovich, who referred me to people in NCAR’s Research Applications Laboratory (including Jason Craig) who could help locate data on aircraft flights over Boulder during cloud occurrence. Carlye Calvin (UCAR Communications) and Sam Hall provided several images that aided in interpreting the behavior of the cloud. Sam also provided considerable help in the effort to determine the cloud height photogrammetically. Bob Rilling provided time-lapse video collected by NCAR’s Earth Observing Laboratory. Bob Henson (UCAR Communications) also played a significant role in the development of this post.
>>>
Margaret "Peggy" LeMone spends much of her free time exploring ways to investigate the world of weather as a citizen scientist. An NCAR senior scientist emerita, she served as the 2010 president of the American Meteorological Society.