Could a weaker Sun avert global warming?
A science meeting sparks a raft of speculative stories
Jun 21, 2011 - by Staff
Temporary impacts to NSF NCAR Road, Parking Lot and Trails
View more information.Jun 21, 2011 - by Staff
Bob Henson | 21 June 2011 • The Sun drives our climate, so a slowdown in solar activity would surely put the brakes on global warming—wouldn’t it? That question percolated through the media last week following a set of reports from a solar physics meeting of the American Astronomical Society in Las Cruces, New Mexico. Three talks each presented a different line of evidence suggesting that the Sun may be poised for one or more decades of lower-than-usual activity. The AAS news release summarizing these clues, plus related graphics, can be found at this website maintained by Craig DeForest (Southwest Research Institute).
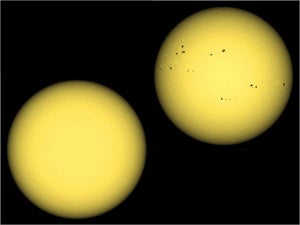
The Sun viewed in visible light at minimum phase (2006, left) and maximum phase (2001, right). (Image courtesy Southwest Research Institute.) View live images of the Sun from NCAR's Mauna Loa Solar Observatory.
The findings prompted a flurry of press coverage nicely summarized by Charles Petit at the Knight Science Journalism Tracker. Petit’s roundup shows that while some articles focused on the Sun’s behavior (as did the talks themselves), others went a big step further, with headlines such as “Earth may be headed into a mini Ice Age within a decade.”
The AAS talks and their aftermath drew keen interest from my colleagues at NCAR who study the workings of climate and the behavior of the Sun. The bottom line, as they see it, is that it’s too soon to know whether a sustained drop in solar activity is in the cards. Even if one occurs, it’s unlikely to put more than a small brake on human-induced global warming.
I asked Mark Miesch, a solar physicist at NCAR’s High Altitude Observatory, what he thought. “The results do indeed suggest that the Sun is doing something unusual,” he says. Miesch agrees that the three sets of data presented at the AAS all point to a systematic decrease in solar activity and a disruption of the normal 11-year sunspot cycle.

Mark Miesch. (Photo by Carlye Calvin.)
History is on the side of a solar slowdown, Miesch adds. “Sunspot records suggest that the activity level in the past 50 to 100 years was unusually high and we should expect a less active Sun in the future,” he says.
The current solar cycle, dubbed number 24, is ramping up slowly, and a consensus forecast organized by NOAA’s Space Weather Prediction Center calls for it to be a weak one (see graph, below). Looking further out, Miesch says the clues presented at the AAS as well as other evidence point to the chance that solar cycle 25, which would peak after 2020, could be even weaker than the now-unfolding cycle 24.
Beyond that point, the forecasts become more speculative. “The Sun has both predictable and naturally chaotic behavior,” he notes. He thinks it’s plausible that the Sun could see a series of lower-amplitude cycles in coming decades, with valleys as deep as 2008–09 and only modest peaks. There’s also the slim chance of a “grand minimum,” a multidecadal period in which sunspot activity drops greatly. Two examples are the Dalton Minimum (1795–1825) and the more extreme Maunder Minimum (1645–1715). The latter occurred in the midst of the Little Ice Age, a fact that helped stoke current media speculation about what a future grand minimum might do.
Aside from sunspot observations, the only way to gauge the Sun’s strength in past centuries is through proxy data. Because an active Sun helps shield Earth from cosmic rays, for example, scientists can infer solar activity by the presence or absence of certain isotopes that are affected by cosmic rays and trapped in ice cores and tree rings. These proxy data show that Maunder-strength minima have popped up a number of times over the last few millennia, lasting anywhere from a few decades to more than a century.
Would we see another event like this coming? The data that led to last week’s announcements are all drawn from techniques that only go back several decades, so there’s no way to directly measure how well they predict an extended solar downturn. “There’s a big jump from ‘unusual’ to ‘grand minimum,' " says Miesch.
As for how all this might affect climate, we can glean some clues by looking at the normal ups and downs of the Sun’s 11-year cycle.
The sum of energy emitted by the Sun—the total solar irradiance (TSI, shown on the chart below)—varies by only about 0.1% from the solar cycle’s peak to valley. This corresponds to a temperature effect on the order of 0.1°C (0.18°F), as noted by solar expert Judith Lean (Naval Research Laboratory), making it a relatively small factor compared to El Niño and La Niña as well as global warming. It’s worth noting that Earth tied its highest temperature on record in 2010 even as the Sun was struggling to emerge from its deepest and longest minimum in a century (as measured by sunspots).
A few studies have used proxy data to estimate TSI during the Maunder Minimum. A decade ago, the drop in TSI was estimated to be as high as 0.3%, but more-recent analyses have brought the percentage closer to 0.1%—or about the same magnitude as the drop noted above that occurs every 11 years during the regular solar cycle.
The modest climate effect of this drop was confirmed in modeling for a 2010 paper in Geophysical Research Letters by Georg Fuelner and Stefan Rahmstorf (Potsdam Institute for Climate Change Research). They used a Potsdam model to simulate climate to the year 2100 in two different scenarios: one in which the last 11-year cycle repeats through the century, and one in which the Sun enters a new grand minimum. Using generous TSI drops of 0.08% and 0.25% respectively, they came up with global temperature dips of around 0.10°C and 0.26°C (0.18°F to 0.47°F). Even the latter drop pales next to the temperature rise of 3°C or more (5.4°F or more) that's expected by 2100 due to human-produced greenhouse gases.
If there’s a wild card here, it’s the effect of ultraviolet rays. The Sun’s UV output varies much more sharply than its total output, rising and falling by as much as 50% within a solar cycle. There are signs that UV can influence weather and climate by interacting with stratospheric ozone and shaping circulation patterns. (Some researchers have also looked into how cloud formation might be affected by cosmic rays, which are modulated by the Sun’s UV, but any such impacts remain unclear.)
That caveat aside, it looks as if a future Maunder-sized grand minimum—uncertain as it is—would fall well short of counteracting human-induced climate change. Tempting as it is to look to the highly visible Sun, it’s the invisible threat of greenhouse gases that looms larger in our climatic future.
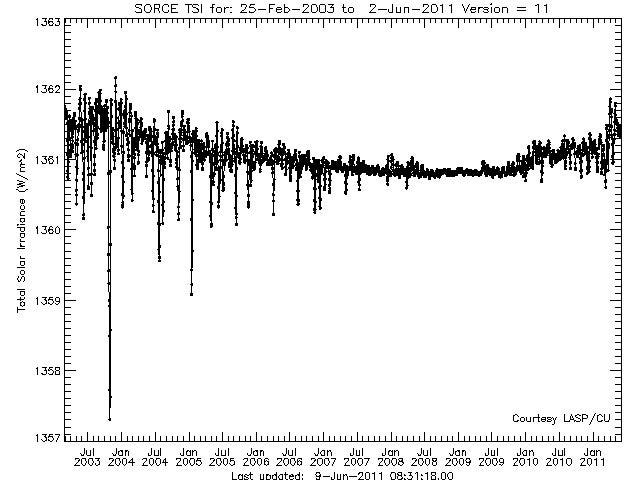
Since 2003, a satellite launched for the NASA-sponsored Solar Radiation Experiment has provided a wealth of data on incoming solar energy at various wavelengths. This plot shows total solar irradiance (TSI) as measured each day during the entire SOURCE mission to date. (Image courtesy SORCE.)