Tracking pollution from the Wallow wildfire
Jun 28, 2011 - by Staff
Temporary impacts to NSF NCAR Road, Parking Lot and Trails
View more information.Jun 28, 2011 - by Staff
David Hosansky | 28 June 2011 • Hazy skies and fiery sunsets were noted across much of the central United States after the huge Wallow Fire developed this month in Arizona. But there’s also a quantitative way to track the fire’s impact on the surrounding air.
The satellite image below reveals the extent to which Arizona’s Wallow Fire and other wildfires affected the atmosphere over the United States from 1 to 12 June. It shows average carbon monoxide concentrations in the lowest six miles or so of the atmosphere, a region known as the troposphere.
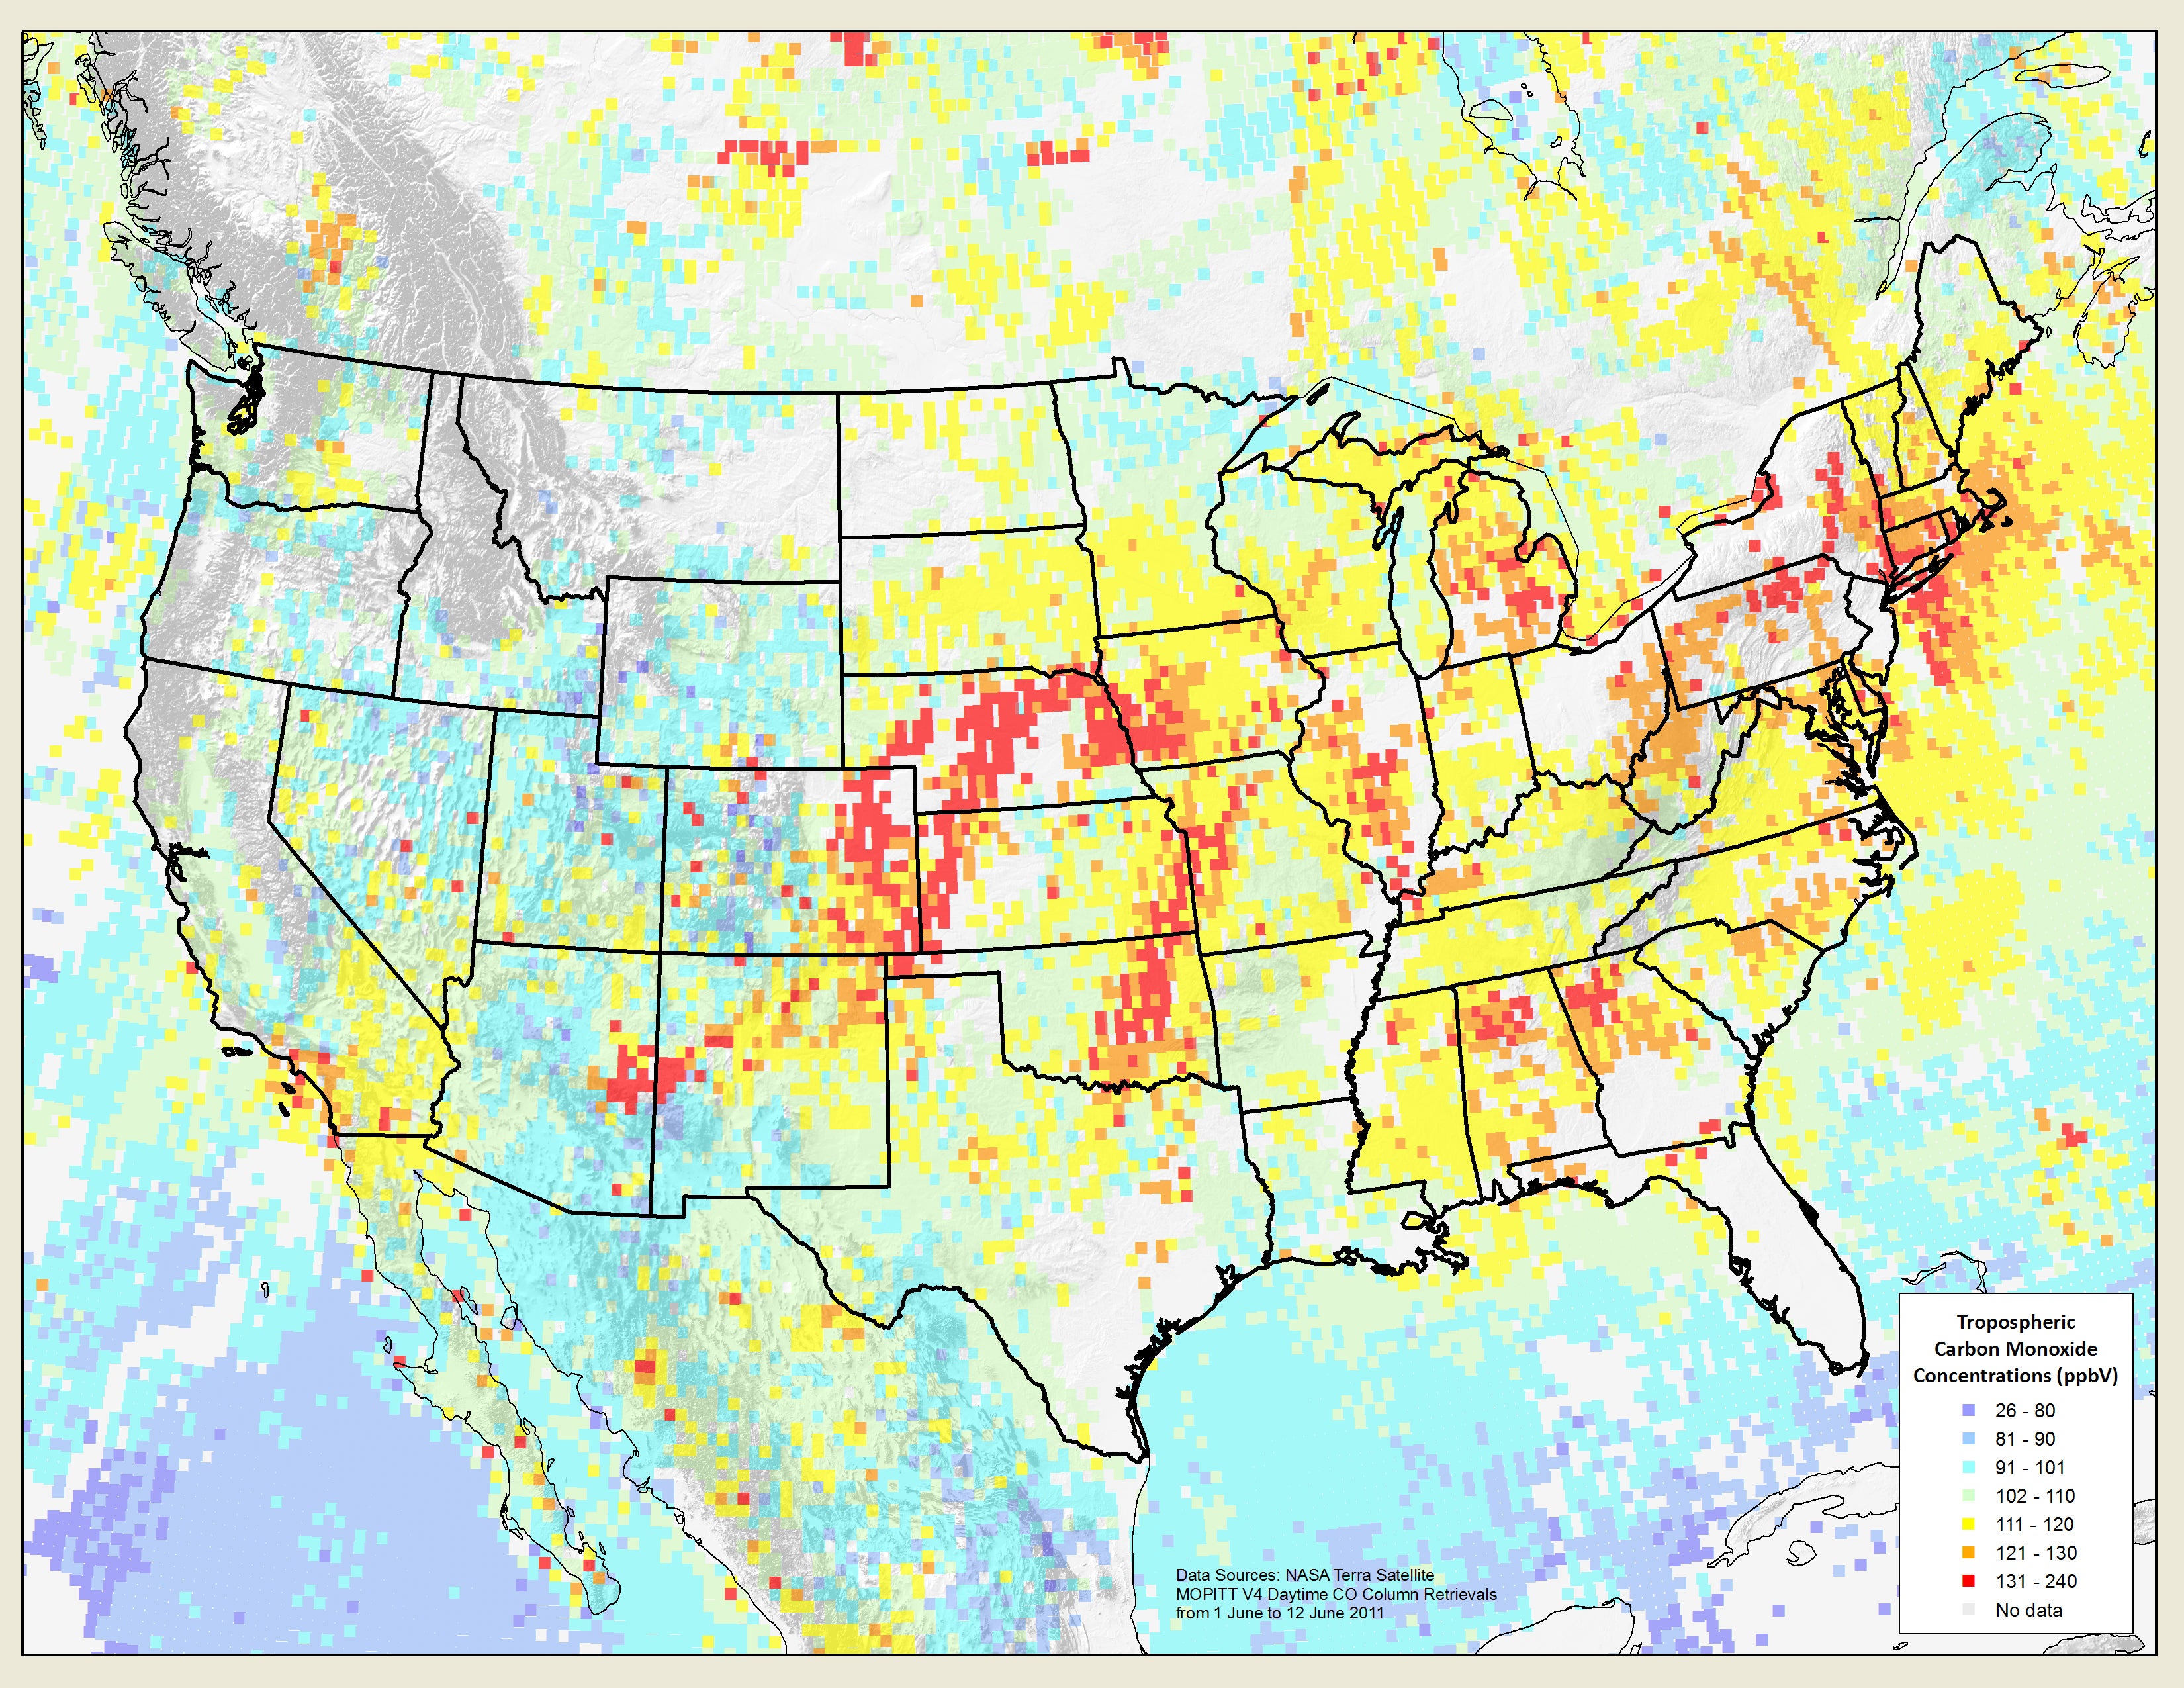
A dense plume of carbon monoxide moves northeast from Arizona’s fires over Colorado and Nebraska, with lower amounts of the gas detectable across much of the Midwest during 1 to 12 June. Much of the Atlantic Seaboard and Southeast also experienced high levels of carbon monoxide. Some may be from the Wallow and other fires, but much of the carbon monoxide in that region typically comes from cities and other sources of pollution. (Illustration by Lex Ivey, based on data by Gabriele Pfister and the NCAR and University of Toronto MOPITT teams, ©UCAR.)
Since much of the carbon monoxide is far above the surface, these measurements don’t necessarily indicate that residents are being exposed to unhealthy levels of air pollution. But the map shows how an intense wildfire can spread emissions across thousands of miles.
“You have so many other sources of carbon monoxide, like traffic and industry, but you can still see the effects of the Arizona wildfires,” says NCAR scientist Gabriele Pfister, who plotted the data for the map. “It shows up as an extreme event.”
To track wildfire emissions, Pfister and her colleagues in NCAR’s Atmospheric Chemistry Division use data from a sensor known as MOPITT (Measurements of Pollution in the Troposphere) that flies on NASA’s Terra satellite. Past MOPITT studies have been instrumental for revealing the impact of wildfires on air quality. For example, Pfister and her colleagues used MOPITT data, along with computer simulations, to show that large-scale 2004 wildfires in Alaska and Canada increased atmospheric concentrations of ground-level ozone across much of the Northern Hemisphere.
Scientists track carbon monoxide because it can contribute to ozone pollution and urban smog, and is a good indicator of the presence of other pollutants. In high concentrations, the gas can harm human health by reducing oxygen to the heart and brain.