Blocking the way
Predicting the atmospheric detours that lead to weather trouble
Sep 7, 2011 - by Staff
Temporary impacts to NSF NCAR Road, Parking Lot and Trails
View more information.Sep 7, 2011 - by Staff
Bob Henson | 8 September 2011 • The concept of atmospheric blocking might not be familiar to the general public, but millions have come face to face with the results of spectacular blocks over the last couple of years. Every so often, a dome of upper-level high pressure sits in place for a few days, sometimes as long as several weeks. A major block can produce seemingly endless stretches of blazing heat or bitter cold. It also blocks the typical eastward flow of the polar jet stream (thus the label “blocking”) and throws storm systems far from their usual tracks. Along those displaced paths, the storms can generate successive bouts of heavy rain or snow. By the time it dissipates, a major block may leave behind a whole stack of broken weather records and an array of disastrous consequences.
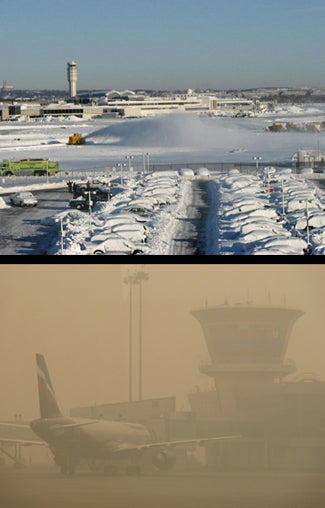
Top: Ronald Reagan Washington National Airport lies snowbound on 7 February 2010, after the first of two major storms in less than a week dropped 20 to 40 inches (50 to 100 centimeters) of snow across the D.C. area. Bottom: Moscow’s Sheremetyevo airport is blanketed by heavy smoke on 7 August 2010 during the last few days of Russia’s extended heat wave. On this day, the airport’s high temperature was a record 96°F (35.5°C). (Top photo courtesy U.S. Navy, Wikimedia Commons; bottom photo by Sergei Gutnikov, Wikimedia Commons.)
Relentless high pressure over Russia led to unprecedented summer heat in 2010, with estimates of more than 10,000 people killed either directly or indirectly. Toward the south side of the Russian block, unusually strong monsoonal flow sent vast amounts of moisture into Pakistan, leading to catastrophic flooding. And when huge bubbles of high pressure popped up in and near Greenland over the last two winters, cities from Washington, D.C., to London found themselves grappling with heavy snow even as parts of the Arctic experienced periods of record mildness.
The recent high-profile blocks have put questions of predictability on the front burner. There’s more than a touch of mystery in what makes a block form and dissipate. Phenomena such as El Niño tend to favor blocking in specific areas, but it’s still difficult for weather prediction models to peg the start and stop times of a particular block. And climate models tend to underestimate the frequency of blocking, which could have an influence on their seasonal-scale averaging of future climate.
“Blocking highs significantly influence climate events over large portions of the Northern Hemisphere,” notes James Hurrell, the new head of the NCAR Earth System Laboratory.
Perhaps because of its challenging nature, blocking has waxed and waned as a topic of research over the last half century. A few years ago, NCAR’s Richard Neale was at the University of Reading and collaborating with the European Centre for Medium-Range Weather Forecasts (ECMWF). At that time, he says, “Blocking was out of fashion. Now I think people are getting more interested.”
In the Northern Hemisphere, you’re most likely to find blocking in the Pacific and Atlantic basins. This is especially true in winter, when the strong polar jet stream arcs around the relatively warm water. Near the north end of each ocean—in the Gulf of Alaska, and over the region between Greenland and Norway—there’s a block in place as much as 25% of the time each winter. In summer, the chance of blocking increases over parts of North America and Eurasia, as heat builds up across these midlatitude continents.
NOAA’s Martin Hoerling took climatology into account when he and colleagues analyzed the 2010 Russian heat wave. “That area is predisposed to getting blocking in summer,” he notes.
Hoerling heads an informal group at NOAA that springs into action in the wake of high-profile, large-scale weather events, such as Russia’s 2010 heat wave or the swarm of U.S. tornadoes in the spring of 2011. After a few weeks of focused work, they issue an online preliminary assessment of the event and the potential role of climate change in shaping it. More extensive peer-reviewed studies typically follow.
In the case of Russia, the team’s initial report pointed to a block that was unprecedentedly strong and unusually long-lasting, with a particularly intense stretch from early July into mid-August. On average, the region gets only about 10 blocking days during those two months. The strength and duration of the 2010 block allowed plants and soil to dry out, which helped send surface air temperatures into uncharted territory. Forest fires and long-burning fires in peat bogs poured smoke into the stagnant block, which degraded air quality and added to the heat wave’s deadly impact.
How much could global warming have contributed? Although the heat wave unfolded during one of the warmest years on record globally, the NOAA group found no evidence of a significant trend in blocking during July over western Russia in the last 60-plus years of upper-air records. And they noted that average July surface temperatures have not risen significantly over western Russia, unlike some other parts of the world and the world as a whole.
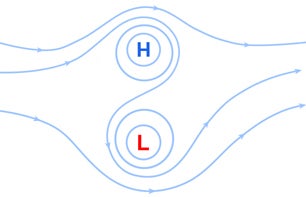
High-over-low blocks feature high pressure to the north and low pressure toward the south (sometimes directly south, as in this schematic). (©UCAR, The COMET Program.)
“Knowledge of prior regional climate trends and current levels of greenhouse gas concentrations would not have helped us anticipate the 2010 summer heat wave in Russia,” says NOAA’s Randall Dole, lead author of a March 2011 paper in Geophysical Research Letters (GRL) that extended the group’s initial analysis. Dole notes that determining an event’s predictability is not the same thing as assessing the precise influence of climate change, a different question requiring different analysis.
The picture can also shift when looking at a broader geographical context. In a feature published in Wired Science after the heat wave subsided, NCAR’s Kevin Trenberth noted the potential links between the blocking high over Russia and persistent low pressure to the southeast near Pakistan. Though they vary in their geometry, ”high-over-low” blocks (see graphic) often produce heavy rains (or heavy winter snows) near the persistent low. Trenberth also noted the moisture-fueling presence of unusually warm waters in the nearby Indian Ocean. In research now under review, NCAR's Thomas Galarneau examines the connections between the Russian high, the Pakistani low, and unusually deep tropical moisture.
Analyzing 2010’s heat across all of Europe as well as western Russia, David Barriopedro (University of Lisbon) and colleagues found that the event was even more widespread and intense than Europe’s unprecedented 2003 heat wave. Erich Fischer (Swiss Federal Institute of Technology) coauthored the analysis, published in Science this spring. “These are such rare events that it’s hard to see trends. It would take many decades or even centuries to amass enough data,” says Fischer. “Of course, the signal will emerge much faster, even for such exceptional events, if the warming trend intensifies.”

Richard Neale (NCAR, top) and Adam Scaife (UK Met Office Hadley Centre, bottom).
The NOAA group stressed that human-influenced climate change should make intense heat waves increasingly likely across western Russia by the late 21st century. By that point, it may not even take a strong block to do the trick, according to analyses by team member Judith Perlwitz (Cooperative Institute for Research in Environmental Sciences). She finds that southern Europe could become so perennially parched that hot air could flow directly to western Russia, instead of being generated in place beneath a major block.
Climate models don’t yet have a firm enough handle on blocks to tell us exactly how they’ll change in coming decades. NCAR’s Neale is one of three co-chairs of the working group that oversees the atmospheric component of the NCAR Community Earth System Model (CESM) and its predecessor, the NCAR Community Climate System Model (CCSM4). By and large, he says, climate models do a good job depicting extratropical cyclones, the lows that regularly sweep across midlatitudes. Blocking is a different matter.
“The jury is still out on how blocks develop, how they become persistent, and how they break down,” says Neale.
In a recent unpublished analysis of CCSM4 output, Neale found that the model was virtually spot-on in capturing the frequency of Euro-Atlantic blocking in summer (see graphic below). “We were pleasantly surprised,” he says. Like most of its peers, though, the CCSM4 still underestimates wintertime blocking over both oceans.
Looking toward the end of this century, the preliminary CCSM4 analysis indicates a slight increase in blocking overall. However, two recent studies suggest that blocking might actually decrease in the northern Atlantic and Pacific, as the average location of the polar jet stream shifts northward.
At Japan’s Meteorological Research Institute, Mio Matsueda ran his lab’s global climate model at varying resolutions to evaluate blocking. For the IPCC A1B emissions scenario, his team found that blocking in both the Atlantic and Pacific decreased substantially by 2075–2099, especially for long-lived events in the Pacific. The group’s results were published in the Journal of Geophysical Research in 2009.
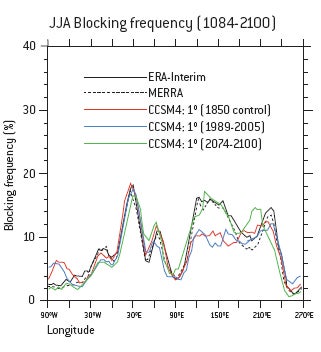
Summertime blocking across Europe and western Asia is well represented by the NCAR Community Climate System Model, version 4 (CCSM4). This new analysis shows what percentage of the time blocking is present in the Northern Hemisphere at a given longitude (bottom axis) in June, July, and August for the observational period (solid and dashed black lines), an 1850 control run (red), the period 1989–2005 (blue) and the warmer climate of 2074–2100 (green). The model tends to increase summer blocking later this century in the North Pacific, with little change produced elsewhere. (Illustration courtesy Richard Neale.)
Similar results, but with a twist, appeared the same year in a GRLpaper by Jana Sillmann (Max Planck Institute for Meteorology) and Mischa Croci-Maspoli (MeteoSwiss). Using Max Planck’s global model, they focused on the Euro-Atlantic region, examining the period 2160–2199 under the A1B scenario. Like Matsueda, they found that blocks became less frequent overall; however, those that formed in winter tended to last somewhat longer than they do now.
Some new hope has emerged for getting more accurate blocking into climate models. Higher resolution could make a big difference, as confirmed by the massive Project Athena, an international effort to verify that representing smaller-scale phenomena can boost the quality of climate models. In work soon to be published, Thomas Jung (Alfred Wegener Institute) and collaborators analyzed runs carried out for Athena using the ECMWF’s climate model. They found that a grid spacing of around 40 kilometers (25 miles) virtually erases the chronic underestimation of blocking in the Euro-Atlantic region.
Much of the improvement appears to stem from a sharper depiction of mountains and other flow-steering land features, says coauthor James Kinter (Center for Ocean-Land-Atmosphere Studies). “Most features of atmospheric circulation that are influenced by orography get better with increasing resolution, and blocking may be one of those,” says Kinter. The finer detail may also be helping the model better capture small atmospheric eddies that can help strengthen a block as they follow the jet stream around it.
There might also be a way to improve blocking in models without the need for high-resolution runs, which can be expensive for regular use. Adam Scaife and colleagues at the UK Met Office’s Hadley Centre have gotten encouraging results by tweaking the mean state of their lab’s climate model. By correcting the model’s bias toward an overly strong polar jet stream over the North Atlantic, the group saw a major boost in how the model handled Euro-Atlantic blocking.
“Reducing the mean bias can lead to greatly improved blocking frequency,” says Scaife. He’s lead author of a 2010 paper detailing this strategy in the Journal of Climate, as well as a study now in review pointing the way toward physically consistent improvements in a moderate-resolution climate model.
Oceans play a major role in setting the stage for blocks. Much of the predictive power of the El Niño/Southern Oscillation (ENSO) lies in its far-reaching web of teleconnections (relationships at a distance). Sea-surface warming in parts of the tropical Pacific, and the heat released by showers and thunderstorms that develop over the warmer ocean, can produce a chain of effects through much of the global atmosphere.
Because of these teleconnections, forecasters have some idea of where blocking is most likely to set up while an El Niño or La Niña is under way. Weather models can’t latch onto the particulars of a given block until a few days beforehand, but some hints can be gleaned from features such as the Madden-Julian Oscillation. The MJO pushes huge areas of convection from the Indian Ocean slowly eastward around the globe’s equatorial regions every 40 to 60 days, influencing weather in a variety of locations.
“Teleconnections are important,” says NCAR’s Trenberth, who has studied ENSO's global impacts extensively. “A lot of blocking is traceable back to the nature of convection in the tropics.”
Less well understood than ENSO, but crucial to winters in eastern North America and Europe, is the Northern Annular Mode and the closely related North Atlantic Oscillation (NAO), which is typically measured as the difference in surface air pressure between Iceland and the Azores. The NAO was strongly negative through much of the winters of 2009–10 and 2010–11, which corresponds to major Atlantic blocking (see graphic). While the NAO can switch modes in a matter of days, a particular mode can also dominate for weeks.
In some cases, the origins of a negative NAO phase may extend further back in time, and higher up, than previously thought. One line of research is looking at how disturbances in the lower atmosphere can send atmospheric waves propagating into the stratosphere and back again. It’s been shown that wind anomalies in the stratosphere can filter downward via the polar jet stream over a period of several weeks or longer, which in turn could help lead to Atlantic blocking and a negative NAO. Researchers have proposed several possible triggers for this chain of events, from heavy snowfall over northern Siberia to a loss of ice extent over the Barents and Kara seas.
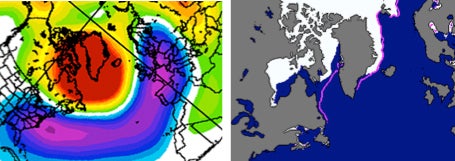
A strongly negative North Atlantic Oscillation led to a high-over-low pattern between November 2010 and January 2011, as shown in height anomalies for the 500-hectopascal pressure surface (left). Persistently strong ridging over and near southern Greenland (red) and low pressure from the mid-Atlantic eastward (blue) teamed up to generate snow and cold over the eastern United States. At the heart of the ridge, the 500-hPa surface was as much as 694 meters (2,276 feet) higher than normal in mid-December—one of the largest such anomalies ever measured, according to The Weather Channel’s Stu Ostro. The ridging coincided with an unusually large area of ice-free water between Greenland and Canada, visible in the difference between average and actual sea ice extent for December 2010 (right, with the pink line marking the median edge of ice extent for the period 1979–2000). (Left image courtesy NOAA Earth System Research Laboratory; right image courtesy National Snow and Ice Data Center.)
Late-season open water has also become increasingly widespread near Greenland, where winter blocking is already favored. Could the upward flux of heat be fueling even bigger blocks and helping nudge the NAO into negative territory? The location of one record-setting block in December 2010 did coincide with a large patch of open water that’s usually frozen by that point (see graphic). But simulations of the NAO later this century don’t even agree that the index will trend more negative, much less how strong such a trend would be.
According to NCAR’s Clara Deser, “The future state of the NAO is highly uncertain due to the large amount of internal variability, even on 50- to 100-year time scales, compared to the changes driven by increased levels of greenhouse gases.” Deser has carried out several model-based analyses of future ocean-atmosphere interactions in the North Atlantic and Pacific.
As climate models get a better handle on blocking and on Arctic sea ice, they may paint a more consistent and realistic picture of details in the Northern Hemisphere’s future climate. “There is not really a robust statement yet on the future of blocking,” says Scaife. In the meantime, there’s a more immediate question at hand: With Arctic sea ice severely depleted once more, will the winter of 2011–12 follow its two predecessors and bring another round of blockbuster blocking? Only the atmosphere, ice, and sea know for sure.