Doping the atmosphere?
When greenhouse gases enter the climate system, what kind of weather comes out?
Feb 6, 2012 - by Staff
Temporary impacts to NSF NCAR Road, Parking Lot and Trails
View more information.Feb 6, 2012 - by Staff
When weather disasters happen, is climate change to blame? The stories, video, and interactives in "Weather on Steroids" explore that question from a number of angles. It turns out that blaming climate change for wild weather's not that simple. Here’s why.
February 6, 2012 • Why does a good love go bad? What makes a sweet kid turn into a rotten adult? And why did Texas see the hottest, driest summer in its history in 2011?
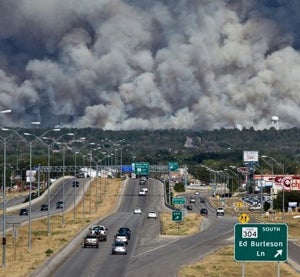
A wildfire near Bastrop, Texas, in September 2011 casued more than $300 million in damage and destroyed more than 1,600 homes. It was the most destructive fire in state history. The United States endured a record 14 disasters in 2011 that each inflicted at least $1 billion in damage, according to NOAA. (Photo © 2011 K. West.)
Some questions don’t have easy answers, but people search for them anyway. We can’t help you with romance or child rearing, but when up to 10% of the trees in your state are dead or dying (as was the case in Texas by the end of 2011), or when your city gets more than twice as much rain in 24 hours as it’s measured on any other day (which happened in Binghamton, New York, last summer), it’s only natural to ask: Was that natural variability or global warming?
Until the last few years, scientists lacked the tools to respond in a satisfying way. But that’s starting to change. Researchers can now estimate how likely several kinds of extreme events would be, with and without human influence. With that information in hand, they can then calculate the probability that a given extreme was made more, or less, likely by our century-plus of fossil-fuel burning.
Scientists at the heart of this work, known as attribution science, see great promise in the emerging ability to provide hard numbers to represent the impact of climate change on extreme weather—even though they sometimes need to cast their findings in a double layer of probability (see graph below).
Myles Allen (University of Oxford).
The emergence and development of the attribution field marks a step away from the more generic statements that climate scientists have given newspaper and TV reporters for years. One of the pioneers of event attribution, Myles Allen (University of Oxford), made this case in a Guardian editorial last October.
“People deserve to know how much climate change is affecting them, and not be fobbed off with banalities like ‘this is the kind of event that we might expect to become more frequent’,” said Allen.
Right now, coming up with these estimates and supporting numbers is a painstaking process, one that can take years for a single extreme event. Each analysis involves big demands on computing power, sophisticated statistical methods, and a crystal-clear definition of ‘extreme’ for the event at hand. The hope among attribution specialists is that they can streamline the process and generate solid results within a few weeks or months, while the memory of an event is still fresh (see Is this climate change?).
For a hypothetical weather event, a study might report findings on the influence of human-produced greenhouse gases with statements like these:
The double layers of probability are because there are two kinds of uncertainty at work:
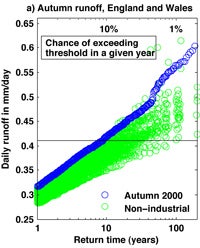
This example from an event-attribution study led by Pardeep Pall (University of Oxford) shows the likelihood of daily runoff from autumn rains that exceeds particular thresholds across England and Wales during the autumn of 2000. The actual runoff (“Autumn 2000”) appears in blue circles. An alternative range of possibilities, produced by computer models for a climate without human influence (“Non-industrial”), is shown in green circles. “Return time” on the bottom indicates the statistical probability that a given flood of that magnitude will not be exceeded within that time (i.e., a 10-year return time corresponds to a 10% chance of such a flood per year). From Pall et al., “Anthropogenic greenhouse gas contribution to flood risk in England and Wales in autumn 2000,” Nature 470 (February 17, 2011).
Accelerating the research can’t avert a weather disaster, but the work has a variety of other uses. City and regional planners could take the risks of a given weather extreme into account for preparation and response planning. The findings might also be used to help direct the billions of dollars pledged by nations to go toward climate change adaptation. And these studies not only illuminate the increased odds of some weather risks—they can also estimate whether other events, such as cold waves or snowmelt-induced floods, are becoming less likely in a greenhouse-warmed atmosphere.
A shocking summer in Europe kick-started the boom in attribution research. Weeks of intense heat in 2003 killed tens of thousands of people across the continent, including more than 14,000 in France alone. Countless temperature records were smashed: England saw its first 100°F (37.8°C) reading in more than 300 years of observations, and Paris had its warmest night ever recorded, with a low of 77.9°F (25.5°C).
Disturbed yet intrigued by the disaster, Allen joined forces with Peter Stott (U.K. Met Office Hadley Centre) and Dáithí Stone (now at the Lawrence Berkeley National Laboratory) to study its roots. In a landmark 2004 Nature paper led by Stott, the trio estimated with greater than 90% confidence that human influence had at least doubled the odds of a record-hot European summer. (For more on how they came up with the numbers, see Fingerprints and percentages, below.)
The 2004 paper marked a turning point in climate change research. Stott, Allen, and Stone have since collaborated with others on several more event-focused studies. One led by Oxford’s Pardeep Pall and published in Nature last year looked at the risk of the kind of flooding that devastated parts of England and Wales in the autumn of 2000. When compared to a simulated atmosphere without the estimated influence of human-produced greenhouse gases, the simulations with those gases raised the risk by more than 20% in 9 out of 10 simulations and by more than 90% in 2 out of 3 simulations (see graphic at right).

Randall Dole (NOAA).
Meanwhile, a group led by Martin Hoerling at NOAA's Earth System Research Laboratory has taken a different approach. They've performed detailed case studies to identify the primary physical processes responsible for specific weather and climate events. They’ve then assessed whether various factors—such as prior regional climate trends; atmospheric, ocean, or sea ice states; or current levels of greenhouse gases—would have provided a basis for early warning of the event.
When dissecting an extreme event, the group’s work examines natural variations in the atmosphere and oceans as well as climate shapers related to human activity. Examples on the group’s Interpreting Climate Conditions website include studies of unusually cool U.S. conditions in 2008, the Russian heat wave in 2010, and the spate of U.S. tornadoes in spring 2011. In some cases, the researchers found that enhanced greenhouse gases contributed only a small amount to the strength of a particular extreme event. But they emphasize that the risk of some such events can still be expected to rise in future decades, as greenhouse gases continue to accumulate.
Despite the different approaches of each research strategy, a shared theme is present: if climate change isn’t the main driver behind a given extreme, it might still play an important role—perhaps as the straw that breaks a camel’s back. Two scientists from Germany’s Postdam Institute for Climate Impact Research, Stefan Rahmstorf and Dim Coumou, estimated in a recent study that local warming has boosted the risk of record-setting heat fivefold in Moscow. In another analysis, Texas State Climatologist John Nielsen-Gammon calculated that global warming added about 0.9°F (0.5°C) to the state’s record-breaking hot summer of 2011, which ran a total of 5.4°F (3.0°C) above average. If so, one might argue it was that extra 0.9°F of human influence—small as it may sound—that helped push the event and its impacts into truly unprecedented territory.

Kevin Trenberth (NCAR).
According to NCAR’s Kevin Trenberth, it’s critical to recognize that every large-scale weather extreme now operates in an atmosphere that’s been altered by fossil-fuel use. Trenberth, who was among the first to attribute seasonal U.S. weather shifts to El Niño and La Niña, emphasizes the context of increased greenhouse gases, higher temperatures, and enhanced water vapor in which extreme events now play out. He and colleagues have mapped global flows of energy and moisture and estimated how much climate change may have enhanced the amount of rain falling in storms such as Hurricane Katrina.
Trenberth’s work relies on a different set of strategies than the ones used by the other groups described in this report (see Extreme weather forensics). While he anticipates much more work on climate change and extreme events, he points to areas of refinement that will further help assess the connections between the two. For example, models cannot yet depict every atmospheric feature with equal accuracy, so key influences may be missed. Also, Trenberth stresses, being unable to prove human influence is not the same thing as being able to disprove it, so researchers may be underestimating the role of climate change by starting from the assumption that it has no influence (the “null hypothesis”).
Each of the lines of research discussed above offers a different take on attribution science. However, the scientists involved agree that the human role in climate change is real and that natural variations, such as El Niño, are a critical part of the mix—as important to study now as ever.
Moreover, their findings aren’t as much in conflict as it may sometimes seem, given that a relatively modest boost in human influence on climate can still lead to a big rise in probabilities for extreme events. One upcoming study led by Friederike Otto (University of Oxford) examines the two analyses of Russia's 2010 heat wave noted above, which seem to diverge, only to find that there is no major contradiction between them.
As NOAA's Randall Dole puts it, “Results that may be widely touted as in disagreement with prior results might in fact be entirely consistent—just stated another way.”
Here’s a rough analogy from everyday life to help distinguish among the different approaches: Adding just a little bit of speed to your highway commute each month can substantially raise the odds that you’ll get hurt some day. But if an accident does occur, the primary cause may not be your speed itself: it could be a wet road or a texting driver. In this analogy, the NOAA group is looking at accident-causing mechanisms of all types, including speed, while the approach of Stott and colleagues (and Rahmstorf and Coumou) is to measure how much that extra 5 or 10 mph hikes the odds that you’ll get into a wreck. Meanwhile, Trenberth is the safety expert pointing out that, as a rule, extra speed is dangerous.
“The human influence on weather and climate is a very slow but enduring influence,” says Trenberth. “Anything on a year-to-year basis is dominated by El Niño and other regional effects, but there is a small, significant, and growing anthropogenic component.”
Which weather extremes have stronger links to climate change than others? How are the news media and insurance industries looking at recent extremes? And why is a climate scientist talking about baseball? Explore answers to these questions and more in the rest of our in-depth report: Weather on Steroids.
Up until the last decade, many scientists hunted for the calling card of increased greenhouse gases by examining large-scale patterns of observed temperature, then comparing those patterns to the output of global climate models—and to the physics of the atmosphere. If the Sun were causing Earth’s temperature to rise, for example, then two of the atmosphere’s outer layers, the stratosphere and mesosphere, would be warming along with the closer-to-Earth troposphere—but they aren’t. (See graphic below).

Gabriele Hegerl (University of Edinburgh).
These analyses of what have come to be known as fingerprints of climate change are backed up by other studies. "By using intensive, quantitative research to interpret the observations with computer models, we can verify that a large part of recent warming is tied to human activity," says Gabriele Hegerl (University of Edinburgh), a world leader in attribution research who recently discussed the topic in the journal Environmental Research Letters.
A series of fingerprinting studies helped strengthen the conclusions about human-produced global warming in the 1996 and 2001 assessments of the Intergovernmental Panel on Climate Change. But Myles Allen (University of Oxford) and colleagues wanted to go a step further and calculate the human influence on a particular weather event. With its sheer horror and scope, the 2003 European heat wave served as a poignant opportunity. And a concept for doing such calculations soon emerged, suggested by Allen in a paper inspired by a flood on the Thames River that had nearly flooded his home.
In their 2004 Nature paper (discussed above), the team used an ensemble of four climate model simulations for the period 1900–2100. Each simulation included a slightly different set of starting weather conditions, to represent the variety of weather outcomes that can result from less-than-perfect observations. The ensemble results agreed that the heat wave’s unprecedented strength almost certainly had at least some contribution from added greenhouse gases.
The new wrinkle in this work was to quantify the term “some contribution.” For this step, the team examined a set of long-term climate simulations in which greenhouse gases were held constant at pre-industrial amounts, or concentrations, which come from analysis of air bubbles trapped in ancient ice cores and from other research on Earth’s paleoclimate. Natural factors that influence climate, such as changes in solar brightness, were allowed to vary.
The scientists calculated how long it took this untouched-by-humans atmosphere to obtain a record-hot summer (temperatures at least 2.9°F or 1.6°C above average). Without the enhancement of the greenhouse effect from fossil fuel burning, such a hot spell occurred in the model only about once every 10,000 years. With it, the record heat occured about every 250 years—and that period may be shortening as the globe warms.
After more statistical analysis, the end result was a spectrum of what’s called fraction of attributable risk —e.g., for each confidence level, there’s a specific probability that humans enhanced the heat-wave odds.
Ironically, it’s easier to generate relative odds like these than to calculate the absolute likelihood of a specific weather event. "Whether or not a temperature record was exceeded in the 13th century is exactly the kind of debate that would run for decades in the blogosphere," says Allen. Yet even if scientists don’t know the precise probability of a particular weather extreme, they can still compare how often such an event occurs in two model atmospheres that are otherwise identical except for the presence of human-produced greenhouse gases. And Stott notes that this approach lends itself to many types of extreme weather, depending on how well models can reliably simulate the key aspects of each.
“Continually testing our models against real-world examples in this way should help spur the development of climate science,” says Stott. “With time, it should provide increasingly accurate assessments of the effects of human influence on extreme weather.”
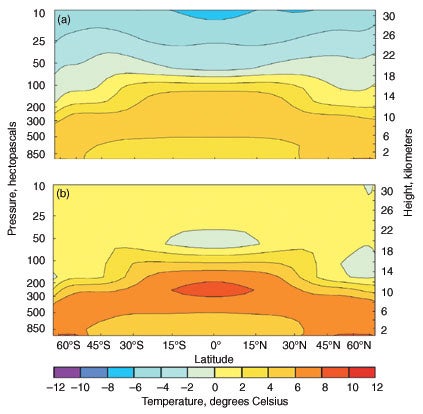
Some of the first fingerprinting studies of climate change were carried out by Benjamin Santer (Lawrence Livermore National Laboratory) and colleagues. The top graphic shows temperature changes by latitude and altitude projected to occur if atmospheric carbon dioxide concentrations double. At bottom is the same graphic showing the expected changes for a 2% increase in the Sun's energy output, with a much different response at higher altitudes. (Image courtesy LLNL.)