Between weather and climate
Seeking long-range forecast clues from the Indian Ocean
Jan 30, 2012 - by Staff
Temporary impacts to NSF NCAR Road, Parking Lot and Trails
View more information.Jan 30, 2012 - by Staff
February 6, 2012 • Terra incognita, they called it: the unmapped land beyond the realm of everyday life. Modern-day weather forecasters have their own zone of mystery—a terra aeris, lurking about four to eight weeks on the horizon.
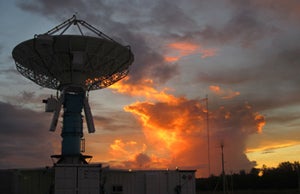
NCAR’s S-Pol was part of an unprecedented array of radars deployed on an Indian Ocean atoll for the Dynamics of the Madden-Julian Oscillation study (DYNAMO). (Photo by Michael Dixon, NCAR.)
There’s been gradual progress on improving specific weather predictions beyond a few days. And seasonal forecasts extending a year or more out provide increasingly better senses of whether precipitation and temperature might be above or below normal. In between, though, are the dragons of intraseasonal variability, which prevent current computer models from telling us much about how major weather features might unfold a month or two from now.
If any phenomenon can shine a light on this murky realm, it’s the Madden-Julian Oscillation, or MJO. “The name is a mouthful,” says Adam Sobel (Columbia University). “But if people are going to be knowledgeable and literate about the climate system, it’s one they should know about.” The MJO is also the focus of a major field experiment that’s brought dozens of scientists, technicians, and instruments to the waters and atolls of the central Indian Ocean.
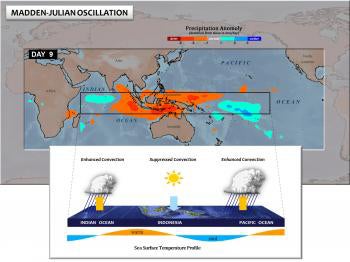
![]() Tropical weather maker in motion. The Madden-Julian Oscillation is a cyclical disturbance of the tropical atmosphere with pulses that typically originate in the Indian Ocean every 30 to 60 days and travel eastward. During each pulse of the MJO, regional westerly winds replace easterly trade winds near the surface, and showers and thunderstorms increase, particularly over regions of high sea surface temperatures in the Indian and western Pacific oceans. (watch QuickTime movie.) (©UCAR. Animation by Lex Ivey, based on data from Adrian Matthews. This video is freely available for media use. For more information, see Media & nonprofit use.*)
Tropical weather maker in motion. The Madden-Julian Oscillation is a cyclical disturbance of the tropical atmosphere with pulses that typically originate in the Indian Ocean every 30 to 60 days and travel eastward. During each pulse of the MJO, regional westerly winds replace easterly trade winds near the surface, and showers and thunderstorms increase, particularly over regions of high sea surface temperatures in the Indian and western Pacific oceans. (watch QuickTime movie.) (©UCAR. Animation by Lex Ivey, based on data from Adrian Matthews. This video is freely available for media use. For more information, see Media & nonprofit use.*)
Recognized in the 1970s by now-retired NCAR scientist Roland Madden and Paul Julian, the MJO is a recurring disturbance that forms in the Indian Ocean about every 40 to 90 days, then moves eastward along the equator into the Pacific Ocean and beyond. The MJO is believed to be the world’s largest source of atmospheric variability on the one-to-three-month time scale. Its reach is enormous: the MJO can shape the course of the Asian and Australian monsoons, enhance hurricane activity in the northeast Pacific and Gulf of Mexico, trigger torrential rainfall along the west coast of North America, and affect the onset of El Niño.
Scientists traveled to the MJO’s spawning grounds in late 2011 and early 2012 for what was the largest study in history of atmospheric and oceanic conditions over the Indian Ocean. They brought a diverse set of tools to the heart of the region, ranging from aircraft and ships to moorings, radars, and numerical models. Their six-month field campaign, known as DYNAMO (Dynamics of the Madden-Julian Oscillation), will help improve long-range weather forecasts and seasonal outlooks and enable scientists to further refine computer models of global climate. DYNAMO’s field phase peaked in October and November and is scheduled to ramp down through March.

Chidong Zhang (University of Miami).
“The Madden-Julian Oscillation has a huge impact all over the globe,” says DYNAMO chief scientist Chidong Zhang (University of Miami). “It connects weather and climate, and it is important to forecasting both of them.”
Other lead U.S. organizers included Robert Houze (University of Washington), Richard Johnson and Steven Rutledge (Colorado State University), James Moum (Oregon State University), Courtney Schumacher (Texas A&M University), and Qing Wang (NOAA).
Many stars aligned to make DYNAMO happen. The campaign is one of three U.S. projects collaborating in the international Cooperative Indian Ocean on Intraseasonal Variability in the Year 2011 (CINDY2011), which is led by the Japan Agency for Marine-Earth Science and Technology. Along with resources and scientists from 16 countries and funding from several U.S. agencies—including NSF, the Department of Energy, the Office of Naval Research, NOAA, and NASA—the effort took advantage of other climate observing systems, including a variety of satellites.
DYNAMO arrived at a time of tantalizing progress in modeling the MJO. At the European Centre for Medium-Range Weather Forecasts (ECMWF), the Integrated Forecast System is now generating a realistic MJO out as far as four weeks into the future (see graphic at bottom of page). NOAA’s Climate Forecast System has also made noteworthy progress in its MJO depictions.

Robert Houze (University of Washington) spent several weeks working on Addu Atoll as the principal investigator with NCAR’s S-Pol radar. Houze may be the only scientist in the world to participate in the largest field experiments of each tropical ocean over the last 40 years, including major campaigns in the Atlantic Ocean in 1974 (GATE), the Pacific in 1992–93 (TOGA COARE), and the Indian in 2010–11 (DYNAMO). “I don’t know what that means other than I’ve been at it too long,” he jokes. (Photo by Stacy Brodzik, University of Washington.)
Some of these advances can be traced to specific improvements whose benefits are well understood, such as the inclusion of better sets of data on initial weather conditions at the start of each model run. In other cases, such as changes in models’ representations of convective clouds, knowing that a particular refinement improved the MJO forecasts doesn’t necessarily explain why it did the trick. That’s because scientists are still learning exactly how the MJO works in nature as well as in models.
Zhang gives high praise to the team from NOAA’s Climate Prediction Center that provided forecast guidance to DYNAMO. “They outperformed both dynamical and statistical models,” he says. “Through these two events, we confirmed that models have serious problems in forecasting MJO initiation.”
One important motivation for DYNAMO is gathering data to help scientists as they look under the hoods of the models. At Colorado State University, Eric Maloney plans to work with colleagues on putting DYNAMO data into a hierarchy of models—including simple single-column models that focus on the vertical flows of air and moisture above a single point—in order to examine features such as the interplay between water vapor and the evolution of showers and thunderstorms.
A 2000 Science paper by Maloney was part of a set of breakthroughs from the 1990s onward detailing how the MJO influences tropical cyclone formation around the world. He found that tropical storms and hurricanes formed about four times more often in the Gulf of Mexico as an MJO active phase approached than just after it passed. That finding alone can be useful to people trying to assess the activity in a hurricane season and plan around it. Maloney and colleagues now want to improve dynamical forecast models so that they can reliably generate and track each active phase of the MJO for weeks on end.
Nature came through for DYNAMO’s planners, as two strong MJO events occurred during the peak of observations in October and November, with only 30 days in between. “The fast pace surprised us,” says Zhang. Radiosonde launches as often as every three hours gathered a wealth of data. In each case, a few days of cloudy, wet weather was followed by two to three weeks of brighter, drier conditions, as the MJO impulse shifted east.

Scott Ellis, field manager with NCAR’s S-Pol radar, points out features of the radar to Maldives vice president Mohammed Waheed Hassan (center) and Courtney Schumacher (Texas A&M University), co–principal investigator with the A&M-based Shared Mobile Atmospheric Research & Teaching Radar (SMART-Radar). While on site, DYNAMO meteorologists helped train forecasters in the Maldivian Meteorological Service in using Web-based radar imagery and MJO data. (Photo courtesy Chidong Zhang, University of Miami.)
Radar screens lit up as each active phase moved over the project’s “super site” on Addu Atoll in the Maldives. “We threw every kind of radar we knew at the MJO,” says Robert Houze (University of Washington). The project’s radars scanned at seven different frequencies, which may be a first in atmospheric research. This gave scientists a rich portrait of mesoscale convective systems—well-organized clusters of showers and storms hundreds of miles wide—as well as tiny cloud “streets” that fed into larger systems and features evident in water vapor even before a cloud formed.
The MJO events of October and November were “pretty amazing,” says Houze, who is working closely with data from NCAR’s S-Pol radar (see cover photo). The radar’s dual transmitters and polarized signals allow it to distinguish rain from hail and detect the water vapor in small cumulus clouds before the clouds become serious rainmakers.
DYNAMO also employed a C-band radar from Texas A&M University that can estimate rainfall and latent heating, as well as a suite of other radars from the U.S. Department of Energy. Two other C-band radars were stationed on two ships that traversed the DYNAMO region. Together, these tools provided scientists with their first-ever opportunity to peer within an embryonic MJO and capture details on the structure of its clouds and rainfall (and its snowfall, which produced distinct signals on S-Pol as it melted several kilometers above the ocean surface).
Many other sensors probed the MJO during DYNAMO, including moored buoys and ship-borne instruments that measured the temperature and salinity of seawater, exchanges of energy between air and sea, and the state of the atmosphere’s boundary layer (its lowest 1–2 kilometers). Also canvassing the study area were two research aircraft provided by NOAA and the French Airborne Environment Research Service, as well as four ships from the United States, India, Indonesia, and Japan.

Observations and detailed reports from the field can be found at the comprehensive DYNAMO Field Catalog, maintained by NCAR. In addition, Adam Sobel (above), Eric Maloney (below), and other DYNAMO participants have been sharing their views in a blog called Madden-Julian Conversation. It includes reader-friendly summaries of MJO/DYNAMO science and glimpses into life for researchers and residents in the isolated atolls of the central Indian Ocean.

NCAR’s Earth Observing Laboratory is accustomed to supporting field projects around the globe, but DYNAMO pushed the edge for both distance and duration. “It was on the other side of the world—basically 12 time zones from here,” says NCAR’s James Moore, director of the DYNAMO project office, which coordinated the far-flung deployments. S-Pol’s trek to the Maldives—nearly a year, between its shipping from Boulder in April 2011 and its return this spring—will be the longest-ever international sojourn of an NCAR radar system.
Among other challenges, Moore and his team created three different versions of the online DYNAMO field catalog to accommodate low-bandwidth, ship-based computers as well as for use on Addu Atoll. They also worked with DYNAMO scientists to adjust the original study area so that pirates roaming the far western Indian Ocean wouldn’t threaten their work.
A field project like DYNAMO can capture only a limited number of cases, but the two strong active phases of the MJO it sampled could go a long way toward meeting scientists’ goals. Whereas a huge clinical trial might gather a subset of medical data on thousands of people, “a field experiment is like getting to know two or three patients really, really well,” says Sobel. “You can’t prove much about the whole population from two events, but we can use the data to study processes on the smaller scales. That will help us improve those physical processes in the model.”
The two active phases are already providing hints on what triggers and drives the MJO, a persistent question mark. “We saw a nice gradual moistening period of the central Indian Ocean during these two events,” says Maloney. “As the moist layer deepened, we had the onset of MJO convection. This supports our hypothesis that you need a certain amount of environmental moisture for an MJO event to form.” Strong bursts of westerly wind accompanied the development of each of the two active phases, and the oceanic surface and subsurface currents responded in a marked fashion, as evident in data collected by ships and buoys.
The MJO’s influence on weather far afield depends in large part on the patterns of rising and sinking air generated as an active phase travels east. The inside view from S-Pol and other radars is helping map out those flows. Houze notes that heat is apparently being released by precipitation at a higher altitude in the large storm clusters of the MJO’s active phase than in the more scattered convection at other times. “Clearly, the active phase of the MJO somehow needs this kind of convective structure,” he says.
Despite its tropical roots, the MJO has some major implications for midlatitudes. For example, the onset of an MJO can set off atmospheric waves that travel across the globe and, about 10 days later, influence the location and severity of major winter storms on the west coast of North America. “If you can find out how an MJO event starts, you may get a couple of weeks warning about wintertime storms in the United States,” says NCAR’s Mitchell Moncrieff, a member of DYNAMO’s science steering committee.
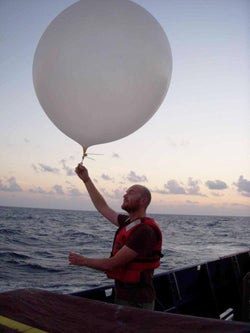
At sunrise on September 4, 2011, Darek Baranowski (University of Warsaw) launches a radiosonde above the eastern Indian Ocean from the deck of the research vessel Roger Revelle, operated by Scripps Institution of Oceanography. (Photo by Bill Brown, NCAR.)
For Moncrieff and others, it’s critical that we learn more about organized, long-lived systems like the active MJO phases that bridge weather and climate. He and Duane Waliser (Jet Propulsion Laboratory) are the scientific leads behind the Year of Tropical Convection (YOTC) project, a “virtual field campaign” with associated research. YOTC is coordinated by the World Climate Research Programme and the World Weather Research Programme/THORPEX.
The YOTC team is working with observations and models focusing on the two-year span from May 2008 to April 2010 (which was lengthened from the original year to capture a transition from La Niña to El Niño). Their goal is to illuminate the physical basis of the MJO and other aspects of tropical convection and their two-way interactions with midlatitude weather.
The findings from DYNAMO and YOTC will help improve climate modeling as well as weather forecasting, says Moncrieff. Progress in both realms has come from high-resolution models, including some that can simulate clouds directly rather than estimating, or parameterizing, their coverage based on other variables. But until these computing-intensive models are practical for regular use, says Moncrieff, scientists will need to determine how to ensure that parameterized clouds are organized in models in the same way as they are in real-world features like the MJO.
“We can make real progress at the weather-climate intersection,” says Moncrieff. “We now have the motivation and the tools for this complex and important task.”
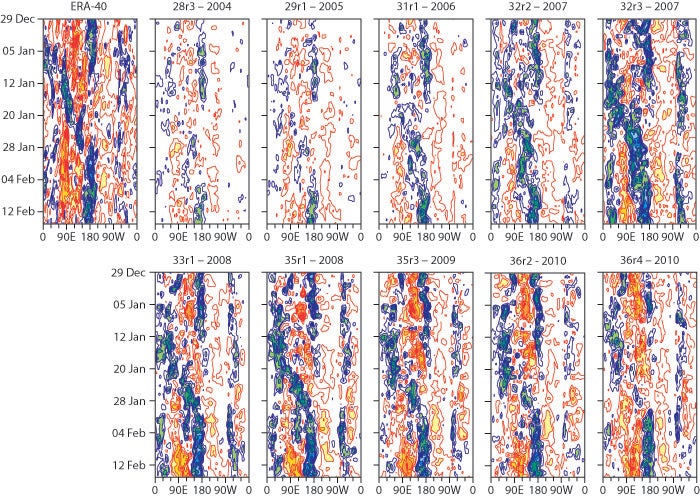
The MJO comes into focus. Various versions of the Integrated Forecast System at the European Centre for Medium-Range Weather Forecasts have developed increasing powers to foresee MJO behavior up to one month into the future. These attempts to simulate an actual MJO event (top left) 15 days in advance show the improvement in successive model iterations from 2004 (upper left) to 2010 (lower right). The model version is abbreviated at the top of each plot. Each plot is a Hovmöller diagram, a common way to show how atmospheric events evolve over time. The colors show outgoing long-wave radiation in the equatorial zone between 10°S and 10°N as it evolves over time (top to bottom of each plot). Red shading denotes warm anomalies in outgoing long-wave radiation (corresponding to the negative phase of the MJO, when convection is suppressed) and blue shading indicates cold anomalies (the convectively active phase of the MJO). The actual event at top left took place from December 29, 1992, to February 15, 1993. [ENLARGE] (Image courtesy Frederic Vitart, ECMWF.)