Wind power wisdom
NCAR science helps society get more energy from turbines
Feb 8, 2012 - by Staff
Early closure on July 3 and 4 - NSF NCAR Road, Parking Lot and Trails
View more information.Feb 8, 2012 - by Staff
February 7, 2012 • There’s much more to wind energy than throwing a few turbines up and watching the blades spin and the cash roll in. Despite a recession-induced slowdown, the U.S. wind industry has continued to grow at roughly 10–15% per year since 2008. But the science underpinning where to install turbines, and how to get the most out of them, is still evolving.
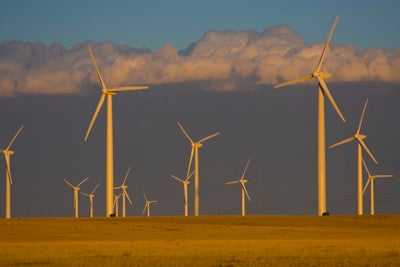
Clouds loom behind a turbine-studded wheat field near Grover, Colorado. (©UCAR. Photo by Carlye Calvin.)
NCAR is now working with a range of partners to help put more rigor and efficiency into the process of wind power prediction and resource assessment. This effort is building on longstanding NCAR research in areas ranging from statistics to artificial intelligence, turbulence theory, and model development. It also comes on the heels of a highly successful three-year project to develop a prototype wind forecasting system for Xcel Energy, which uses more wind power than any other U.S. investor-owned utility.
“What we’re doing is research and development to improve the state of the art,” says Sue Ellen Haupt, program manager for renewable energy at NCAR’s Research Applications Laboratory (RAL). Some 30 people in RAL now spend some or all of their time on wind energy projects.
Large companies don’t generally share proprietary information on wind farms, but by collaborating with such firms, RAL is generating research that can enhance the wind energy industry as a whole. At this year’s annual meeting of the American Meteorological Society (AMS), there were more than a dozen talks and posters by NCAR staff on wind energy efforts, many of them part of the Third Conference on Weather, Climate, and the New Energy Economy.
Sue Ellen Haupt is program manager for renewable energy at NCAR's Research Applications Laboratory. (©UCAR. Photo by Carlye Calvin.)
The Front Range of Colorado is now one of the world’s leading centers of wind energy research and commerce, which allows for regional collaborations that span the public and private sectors. At the same time, RAL is eager to work with interested universities regardless of their locations, says Haupt: “We’re always looking for scientists who have skills that can translate into the wind energy arena.”
NCAR’s most prominent success to date in wind energy prediction has been the forecasting system it developed for Minnesota-based Xcel Energy. The system saves ratepayers several million dollars yearly ($6 million in 2010 alone) by enabling utility operators to anticipate the amount of wind energy produced at wind farms within Xcel’s service areas, which span much of the central United States. Thanks to forecasts that are updated every 15 minutes (see graphic), the utility can save money by powering down coal and natural gas plants when possible while maintaining a reliable power supply for its customers.
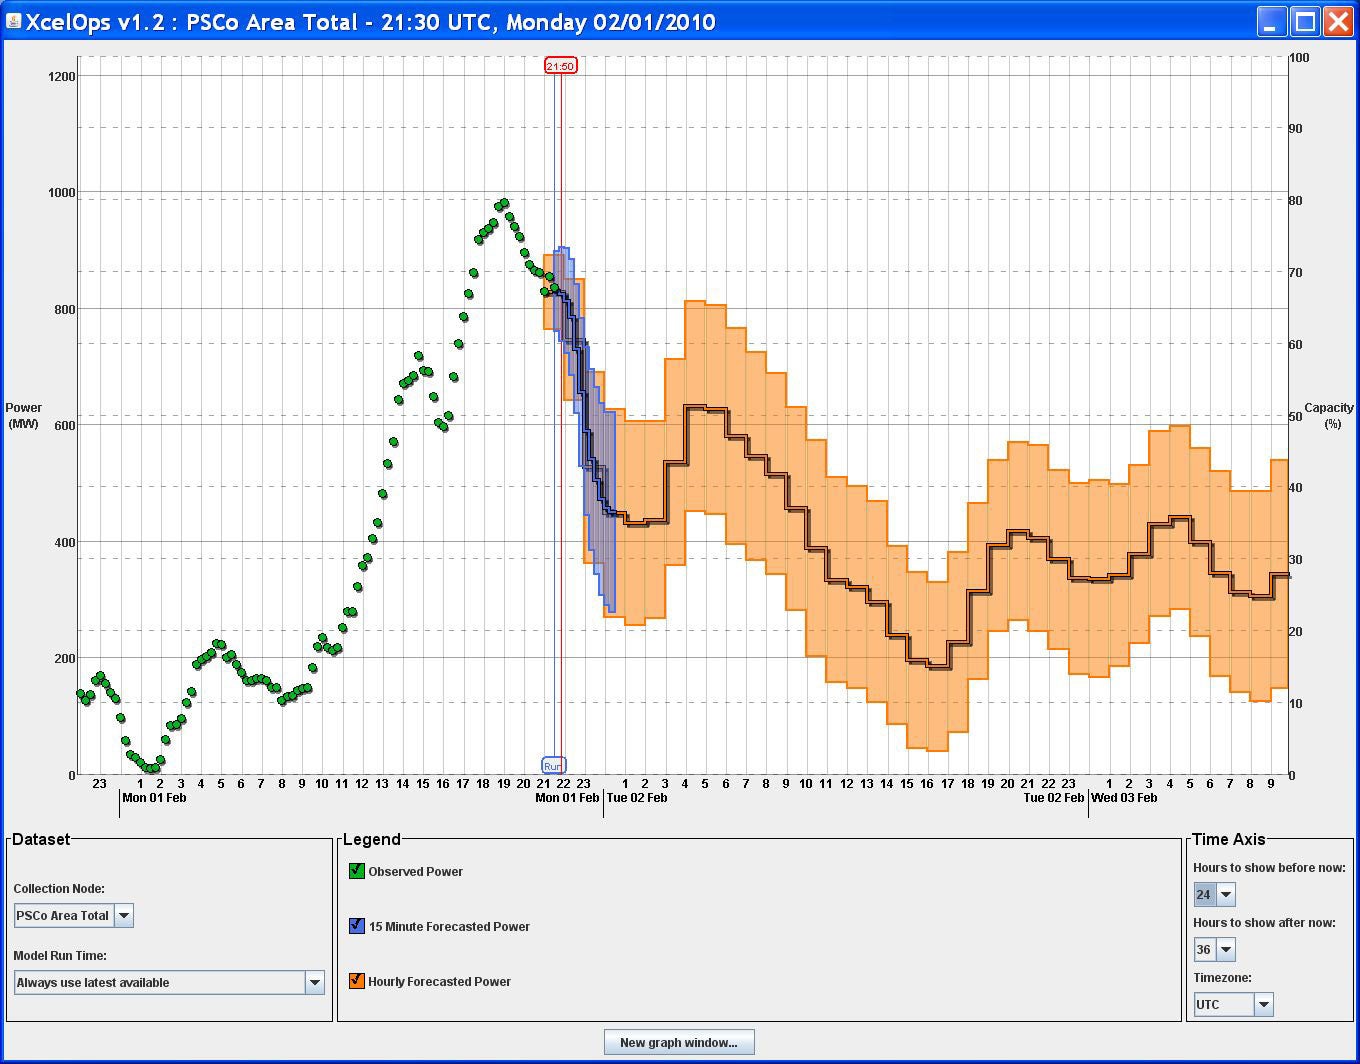
This graphic shows sample output from NCAR's wind energy prediction system for Xcel Energy (click to enlarge). The time moves ahead from left to right, with hours (in UTC) shown along the horizontal axis at bottom and power output (in megawatts) shown along the vertical axis at left. The green dots at left represent actual power generated in megawatts up to the initial forecast point of 2130 UTC (2:00 pm MST) on February 1, 2010. The solid line shows the predicted power in megawatts for the next 36 hours. Orange shading around the solid line represents the typical forecast error from the preceding seven days. The actual wind should fall within the orange prediction zone about 75% of the time. Operators can choose to display data by turbine, farm, or larger region, and by time up to 120 hours in the future. [ENLARGE] [NCAR/XCEL]
“Every fraction that we can improve the forecasts results in real savings,” says RAL deputy director William Mahoney, who headed the project’s development.
The system was formally handed over in October 2011 to Xcel. NCAR will continue to make refinements on request, and the system will continue to become more accurate on its own: its software automatically makes adjustments based on any differences between the energy forecasts and actual energy generation.
The project built on forecast technologies that NCAR has successfully developed for the U.S. military, the National Weather Service, the aviation industry, the U.S. Department of Transportation, overseas governments, and other public and private entities. Observations from a variety of sources feed into four NCAR-based tools that include:
In a new Gold Rush of sorts, wind energy developers are “prospecting” for the best sites to generate reliable streams of wind. Ideally, the breezes should be moderately strong and minimally variable.
“For the energy industry, very precise wind resource assessments are crucial, since financiers and insurers must determine the long-term profitability of prospective wind farms,” says former NCAR scientist Daran Rife, now at GL Garrad Hassan, a global renewable energy consultancy. Rife adds that even a small amount of wind speed variability can generate a difference of more than $1 million in revenue per year for a typical 250-megawatt wind farm.
One of the first tasks in evaluating a potential turbine site is to gather data by placing an instrumented tower or other sensors on the site for one to two years. The next step is to construct a long-term wind climatology (known as a reference time series) that captures the variability in wind speed at turbine height (typically around 80 meters, or 260 feet, above ground) every 1 to 3 km (0.6–1.8 mi) across a target area. Modeling at that fine a scale is prohibitively expensive, so the standard technique is to downscale results from larger-scale reanalyses of past atmospheric conditions. These are generated by national centers such as NASA at resolutions of 50 km (31 mi) or more.
After these steps, a climatology is typically produced for 365 days of wind data, with each date randomly chosen from the preceding 10 years of model analysis. But this approach, even when combined with a year of onsite observations, can drastically underpredict the frequency of both light wind and extreme wind events. Moreover, it doesn’t guarantee that the selected dates represent a realistic sample of the historical wind conditions. For example, the difference in average January wind speeds between an El Niño and a La Niña year can be more than 6 meters per second (13 miles per hour) over parts of coastal California, with similarly large changes in wind variance.
A new method developed by Rife and colleagues at NCAR and three renewable energy firms—V-Bar, GL Garrad Hassan and TradeWind Energy—promises to help developers identify prime wind sites more quickly and accurately. Instead of randomly selecting a single 365-day set of wind data, the new method creates thousands of such sets. It then uses a statistical technique, the Monte Carlo method, to compare each set to a high-quality reanalysis of observations of wind in the general vicinity. The set that aligns most closely with the observation-based reanalysis is selected as the basis for a detailed map of likely winds at the site.
Such a method, when combined with a year of actual observations, reduces the uncertainty in average wind speed by as much as 40% compared with the current approach. Moreover, it is so effective that an energy company can analyze just 180 days of data using this technique and obtain results as reliably as the current 365-day approach with far less cost and effort.
Supported by NASA, the project drew on the agency’s Modern Era Retrospective-analysis for Research and Applications (MERRA), which provides three-dimensional data for every six-hour period since 1979 using both surface- and satellite-based measurements. “MERRA represents the new gold standard in global reanalysis,” says Rife.
RAL is also using its own state-of-the-science global reanalysis for wind resource assessment, one that provides global coverage for 1985–2005, using a 40-km (64-mi) horizontal grid. Created with NCAR’s WRF-based Climate Four-Dimensional Data Assimilation (CFDDA) system, this reanalysis provides hourly 3-D output, which permits the full diurnal cycle to be analyzed for any point on the globe.
The critical zone for wind energy is the ground-hugging region known as the atmospheric boundary layer. Stronger winds aloft often mix into the boundary layer during the day, when the zone typically expands to a depth in the range of 2–3 kilometers (1.2–1.9 miles). That’s more than deep enough to safely encompass a wind energy turbine and its blades within the boundary layer during the day. Nighttime is a different matter.
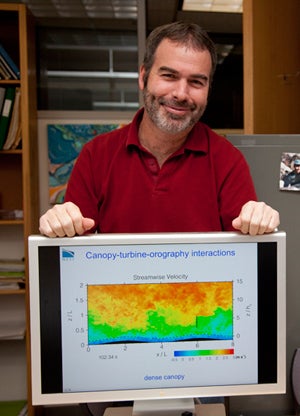
Edward Patton (NCAR) studies turbulence and its role in wind energy.(©UCAR. Photo by Carlye Calvin.)
“As the sun goes down, the turbulence collapses, and the boundary layer may be 100 meters deep or less,” explains Edward Patton, who is a member of the boundary-layer group in NCAR’s Mesoscale and Microscale Meteorology Division.
Especially at night, winds can be very strong just above the top of the boundary layer but much lighter just below that interface. If a turbine’s blades spin into and out of the boundary layer every few seconds, the resulting stress can be enough to damage a turbine’s gearbox. “It’s a serious problem,” says Patton. He and colleagues are finding that wind energy developers are keenly interested in how the boundary layer works. “We’re really trying to get at the science behind these deployments,” he says.
Over the last few years, Patton has studied how trees, hills, and other obstacles can affect the air flow in and near wind turbines. He’s simulated these events using NCAR’s large-eddy simulation (LES) model, an influential tool developed by Chin-Hoh Moeng over the last 20-plus years to analyze turbulent flow. The model illuminates processes that are sometimes overlooked by wind energy prospectors, such as the potential for the formation of breaking Kelvin-Helmholtz waves at the top of the boundary layer at night. These atmospheric waves are the same type that can produce clouds resembling a series of ocean waves. LES processes representing the behavior of wind turbines themselves have also been woven into the WRF model framework by RAL’s Branko Kosovic, in collaboration with Lawrence Livermore National Laboratory and Siemens.
A team that includes scientists from NCAR, the wind energy firm Vestas, and Northwest Research Associates is now embarking on a project funded by the U.S. Department of Energy to examine how ocean waves can themselves influence the wind at turbine height. At NCAR, Peter Sullivan has spent more than a decade studying the many ways in which ocean waves and the atmosphere interact. The new DOE effort will examine how atmospheric impulses produced by large ocean waves, including swell, might propagate upward and affect turbines located offshore or near shore. The goal is to find ways to represent these processes within models.
“The understanding of how waves interact with the atmosphere is novel territory,” says Sullivan. The most complex set-ups are when swell and winds are flowing in the same direction but at different speeds. Only in the last few years has parallel processing allowed computers to model a three-dimensional spectrum of water waves that captures much of the variety evident on a real-world ocean surface. These waves influence the atmosphere in far more complicated ways than what’s called stationary roughness—trees, buildings, and the like.
Another research frontier is the effects of turbines within a wind farm on the atmosphere and on each other. As wind flows around a turbine and through its blades, its speed is reduced while turbulence increases. NCAR’s Jimy Dudhia is working on new techniques to represent such processes in modeling with WRF, which is widely used for wind energy research and prediction at NCAR and elsewhere. WRF’s first publicly available wind-farm parameterization—whose development was led by Ana Fitch, a graduate student visiting Colorado from the University of Bergen—was added to the model last spring.
And since wind farms often share the land with traditional farms, it’s important to know whether their turbines might have effects, good or bad, on crops beneath them. Over the summers of 2010 and 2011, Eugene Takle (Iowa State University) led the Crop/Wind-Energy Experiment. It drew on sensors from ISU, CU-Boulder, NCAR, the National Renewable Energy Laboratory, and the National Laboratory for Agriculture and the Environment that gathered data on turbulence, sensible and latent heat, and carbon dioxide fluxes upwind and downwind of wind turbines across a central Iowa corn field.
So far, according to Takle and colleague Julie Lundquist (CU), it looks as if the turbines create modest but measureable changes in the microclimate for Midwestern crops. The pressure variations and turbulence produced downstream of turbines appears to help stir the air near the ground, which may affect surface fluxes. “Under the weather conditions of the experiments we have conducted so far, the influences seem generally small, although some episodes show higher carbon dioxide uptake by corn fields behind the turbines,” says Takle.