A splash of reality
As water use grows, scientists grapple with an uncertain future
Aug 13, 2012 - by Staff
Temporary impacts to NSF NCAR Road, Parking Lot and Trails
View more information.Aug 13, 2012 - by Staff
August 13, 2012 | When it's clean, plentiful, accessible, and controllable, water is easy to take for granted. Things are different when the supply becomes a torrent—or a trickle. For much of the United States, the summer of 2012 has been one of those times. The most extensive U.S. drought in almost 60 years has enveloped some of the nation’s most productive farmland. The impacts go well beyond agriculture: in parts of the Midwest, shifting soils are cracking building foundations and prompting water restrictions more familiar in California than Indiana.

In this image, the large bubble atop the central United States represents the volume of all of Earth's water, including oceans and groundwater. The smaller bubble atop Kentucky denotes the volume of Earth's freshwater (groundwater, lakes, swamp water, and rivers), while the tiny bubble over Georgia represents lakes and rivers alone. (Image courtesy USGS Water Science Photo Gallery.)
Even as public attention comes and goes, water is consistently Topic A for a wide-ranging group of researchers. Hydrologists have teamed with meteorologists, climate scientists, and engineers to analyze flood, drought, and water storage. The last decade has seen breakthroughs in the mapping of glaciers and aquifers, plus a steadily improving picture of how water flows into and out of the atmosphere. In the United States, there’s a growing network of drought specialists and an enhanced warning system for regional drought.
These advances are running neck and neck with ominous trends. Earth’s warming climate threatens to shunt precipitation toward polar regions and the tropics, with an increased risk of drought at latitudes where billions of people live. Higher temperatures will tend to pull more water out of soils. Even without climatic change, the global demand for water continues to grow hand in hand with population. Water access already varies hugely among countries, and major U.S. aquifers are being depleted at a worrisome pace.
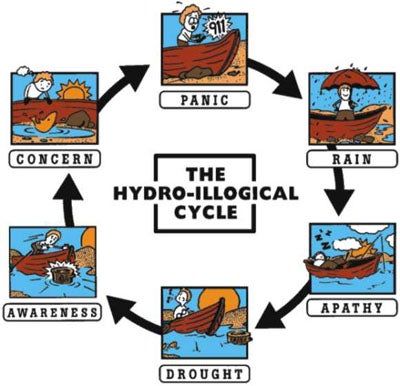
As portrayed by the National Drought Mitigation Center, the “hydro-illogical cycle” describes how drought, as a slow-moving natural disaster, tends to emerge under the radar screen, then intensify until people can no longer ignore it or wish it away—until it rains again. (Illustration ©National Drought Mitigation Center.)
As they work to understand the hydrologic cycle that sustains our water supply, and the evolution of climate factors that may change it, scientists and policy experts at NCAR and elsewhere bemoan what’s been dubbed the “hydro-illogical cycle,” where pulses of public concern triggered by drought evaporate as soon as the rains return.
“We ignore drought until the situation is dire, lament the impacts, justifiably call for help, and clamor for emergency funding,” said J.D. Strong, executive director of the Oklahoma Water Resources Board, in written testimony before Congress on July 25 (see PDF). “But invariably it rains, at which point we forget there was ever a problem and go back to business as usual. We must break this cycle.”
In this special report, we take a closer look at water availability and the science that's under way at NCAR, UCAR member universities, and a variety of other partners to help us predict its course.
With more than 70% of Earth covered by oceans, it’s impressive how small the supply of freshwater is by comparison—only about 2 to 3% of the planet’s total water (see graphic). More than two-thirds of that freshwater is locked up in polar ice sheets. Much smaller amounts lie in ice caps and glaciers at lower latitudes, where people can access meltwater. Most of the world’s remaining freshwater is held in deep, inaccessible underground aquifers and within the soil itself. Less than 1% of all global freshwater is readily available in rivers, reservoirs, lakes and shallow aquifers, according to a University of Michigan report.
As for the atmosphere, it’s not so much a home for water as a highway for it, according to NCAR's Kevin Trenberth, who heads the scientific steering committee for a major international effort to map the world's energy and water cycles (see sidebar at bottom). According to Trenberth, a typical molecule of water vapor enters the atmosphere from the ocean and spends 8 to 9 days in the air before it returns earthward as rain or snow and flows toward the ocean. At that point, the molecule is usually hundreds or even thousands of miles from the place where it evaporated.

Earth’s water is perpetually in motion through the global hydrological cycle, which involves ocean, land, clouds, lakes and rivers, plants, snow, and ice. (© UCAR. UCAR Digital Image Library.)
It’s a major task for scientists simply to map out how much water exists at each point in this hydrologic cycle. River flows and reservoir levels are monitored around the world, but many nations are hesitant to release the data for research. Moreover, experts have warned for years that the longstanding network of river gauges in many areas, including the United States, is deteriorating.
Measuring evapotranspiration (ET)—the process of water transpiring from plants and evaporating from soil, pavement, and other surfaces into the air—is a challenge of its own. About two-thirds of all rain and snow that falls on land areas ends up entering the atmosphere this way. But there’s not yet a gold-standard measurement technique for ET, and variations in space and time remain poorly mapped.
There’s been some promise in combining land-based measurements of ET at specially equipped sites with satellite-based estimates over broader regions. More than a dozen institutions from eight nations have been working over the last several years to evaluate such ET datasets in a project called LandFLux-EVAL. And a team led by NASA’s Matthew Rodell used new ET data to balance the water budgets for seven river basins in Africa, Europe, and North and South America.

Evapotranspiration (ET)—the amount of water vapor entering the air from sources other than oceans—varies dramatically across the United States, as shown in this map of total ET for the 2007 growing season (May 1–September 30). In parts of the Deep South, ET averaged as much as 15 mm (0.6 inches) per week. The map was prepared by Baburao Kamble as part of a project to assess ET on a weekly basis using data from NASA’s MODIS satellite. (Image courtesy Baburao Kamble, University of Nebraska Lincoln.)
Trenberth and colleagues are using a variety of datasets to put together energy and moisture budgets on a continent-by-continent basis, depicting flows in and out of each part of the Earth system over the lifecycle of various ingredients. “We’re trying to see how well we can complete the budget not only for the average but for each month,” says Trenberth, who plans to report on the work in December at the annual meeting of the American Geophysical Union. “I think we may be closer than anyone has been so far.”
It’s not only long-term budgets that pose challenges when it comes to modeling the flow of water. For short-term weather models, the emphasis is on correctly depicting the timing and location of rain and snow. This depends on a variety of model aspects, including how observations are assimilated in the model and how well the land surface is depicted, according to NCAR’s Jimy Dudhia. He’s one of the lead developers of ARW, the advanced research version of the multiagency Weather Research and Forecasting model.
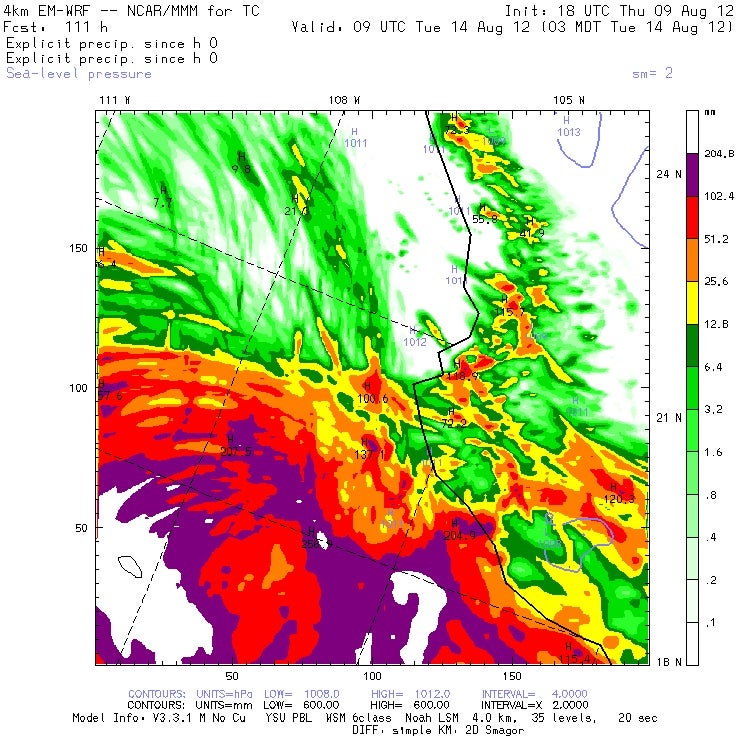
During 2012 hurricane modeling exercises, researchers used the advanced research version of the Weather Research and Forecasting model (NCAR WRF-ARW) to track Hurricane Ernesto as it weakened and moved inland across southern Mexico. This forecast, issued for 0900 UTC on August 14, projected that more than 204 millimeters (8 inches) of rainfall would fall across some areas (shown in white) over the preceding 111 hours. In this version of the model, the spacing between grid points is 4 kilometers (2.5 miles). Click to enlarge. (Image courtesy NCAR/NESL/MMM.)
Dudhia adds that short-term models serve as a critical tool in predicting the risk of flash floods. “This is a challenge because the river flow depends so critically on the position, timing, and intensity of rainfall from thunderstorms, especially over complex terrain,” says Dudhia.
Climate models have a different assignment—depicting the trends in water behavior over larger areas and longer periods—so they typically include more aspects of the water cycle, including those that play out gradually.
The NCAR-based Community Land Model (CLM), one component of the NSF- and DOE-funded Community Earth System Model (CESM), tracks moisture as it evaporates and transpires, falls as rain or snow, enters river channels, and infiltrates the soil. The CLM also depicts accumulating snowfall and includes a reservoir that simulates the water table.
Because of perennial limits on computing power, models like the CLM have often specified glaciers, wetlands, and lakes as elements that remain fixed as the climate evolves. Now, says NCAR land modeler Samuel Levis, “we’re beginning to simulate how some of these water bodies may change in response to simulated changes in the climate.”
Another branch of models looks more specifically at where water is headed across and below the land surface, with an eye toward helping water planners. Reed Maxwell (Colorado School of Mines) heads up the ParFlow project, an open-source model of watershed flow that draws on CLM and other components developed at NCAR, Los Alamos National Laboratory, the University of Bonn, and the University of Colorado Boulder. A similar effort in Canada, Hydrogeosphere, was developed at the universities of Laval and Waterloo.

At Michigan State University, David Hyndman and colleagues are using integrated hydrologic models to examine how precipitation and temperature may shift as climate change affects the water cycle. (Photo by Kurt Stepnitz, courtesy Michigan State University.)
At Michigan State University, a team led by David Hyndman is looking at future changes in the water cycle using MSU’s large-scale, high-resolution Integrated Landscape Hydrology Model. “It’s taking the what-if scenario of projected changes in temperature and precipitation and putting that into something that people understand and relate to,” says Hyndman.
Of course, human interventions into the hydrologic cycle can be profound, as people dam rivers, tunnel through mountains, and construct canals to move water from its origins to where it is needed. NCAR scientist David Yates and colleagues at the Stockholm Environment Institute have been developing the Water Evaluation and Planning (WEAP) systems model to help water managers and planners understand the implication of climate on our coupled natural and managed water systems. (See "Who needs glaciers?")
As greenhouse gases continue to pile up in a warming atmosphere, the job of tracking and projecting Earth's freshwater gets even more complex. But there’s already a good deal of clarity about the direction of some key water trends.
For one thing, higher temperatures are expected to rev up the hydrologic cycle. Warmer air allows more water to evaporate from both land and sea, and that added moisture will tend to intensify rain and snow when and where they form, a trend already being observed in the United States and many other places. On the flip side, the dry spells in between precipitation events will tend to grow longer. Combined with the increased ET from soils, this means an enhanced risk of drought in much of the globe, even where total precipitation may not be changing. New work by NCAR’s Aiguo Dai confirms this outlook.
It’s also become more evident that climate change won’t treat all latitudes equally. Climate models still disagree on how precipitation will change in some regions. However, they concur on the big picture: the dry-leaning zones of the subtropics, centered around latitudes 30°N and 30°S, will tend to expand into the midlatitudes and dry out even further, putting intensified pressure on regional water supplies. For example, the dry, sunny climates found in the southwestern United States and the Middle East have fostered irrigation-dependent agriculture and drawn ever-increasing numbers of residents. Meanwhile, precipitation is expected to increase on average closer to the poles and in the belt of heavy rainfall near the equator that shifts north and south with the seasons.
(Photo courtesy David Kreamer.)
Hydrologist David Kreamer (University of Nevada, Las Vegas) is encouraging his peers to look at society’s access to water in the broadest possible terms. At a July 2012 meeting in Boulder, Kreamer pointed out that roughly a billion people lack access to clean drinking water and about 5 million die each year from water-related illnesses.
To address these issues, Kreamer and other water experts, including Michael Campana (Oregon State University) and his WaterWired blog, are putting energy toward what Kreamer has dubbed hydrophilanthropy. (See PDF of Kraemer’s 2010 article in the Journal of Contemporary Water Research and Education.)
“Solutions to global clean water problems are achievable,” said Kreamer. “I think people who are involved in water have a natural proclivity to be philanthropic.”
Kraemer reached out to colleagues at the biennial meeting of a unique group fostering collaborative work on water issues. The NSF-sponsored Consortium of Universities for the Advancement of Hydrologic Science (CUAHSI) includes more than 100 colleges, universities, and other institutions. Its major products include online data catalogs, open source software, and the biennial meeting, which is hosted by UCAR every other summer in Boulder.
Dozens of researchers gave talks and presented posters in July at this year’s meeting. Keynote speakers included Roger Pielke Jr. (University of Colorado Boulder), Soroosh Sorooshian (University of California, Irvine), and Tom Dunne (University of California, Santa Barbara).
“At the high latitudes and the low latitudes, we’re actually seeing increasing water tables,” says Jay Famiglietti, who directs the Hydrology & Climate Research Group at the University of California, Irvine. At the same time, he adds, “Most of the aquifers in midlatitudes are under huge stress.” (See “Reservoirs beneath our feet.”)
Glaciers will also feel the pinch of a warming climate, although there are many questions about how quickly an increase in glacial melt might segue into eventual depletion for the millions who rely on glaciers as a primary or supplemental water source. (See “Who needs glaciers?”)
As water managers contemplate the future, they’re paying close attention to where efficiency and conservation can make the biggest gains. A new global outlook by the National Intelligence Council predicts that nearly half of humanity will live in water-stressed regions by 2030.
Globally and nationally, agriculture gulps more water than any other part of society, making up roughly 80% of water consumption. A single farmer atop the Ogallala Aquifer of the High Plains may draw on as much water as a good-sized city. The ongoing global rise in meat eating is expected to put additional strain on water resources, since it typically takes more water to produce a calorie of meat versus one of grain.
The energy sector accounts for an estimated 27% of nonagricultural U.S. water use, as noted in a 2010 Harvard report. Aside from the large amounts of water required to grow corn for ethanol, water is pumped through coal plants and nuclear reactors to keep them cool. Much of that water returns to source streams, albeit at higher temperatures than before. Large amounts of water are also pumped into the ground to squeeze out oil and natural gas, through the technique known as fracking (hydraulic fracturing). This year’s drought is already putting a crimp on the hydrocarbon boom in some U.S. states.
For the public, water utilities are the most familiar part of the supply chain, especially when customers are asked or required to restrict water use during dry periods. Through his work with a variety of clients from Florida to California, NCAR’s Yates has seen what happens when finite supplies go head to head with development pressures. “It’s hotly political. People want to build,” he says. However, he believes the intensity of recent droughts, together with rising demand, is starting to engender more caution: “I think the utilities are questioning their assumptions.”

David Yates (©UCAR. Photo by Carlye Calvin.)
A utility-based alliance is now helping bring water providers into the loop on climate research. (See ”Keeping the tap flowing.”) Yates and NCAR economist Kathleen Miller published a guide (see PDF) to help drinking water utilities anticipate how climate change might affect supply and demand. And Yates collaborated with Denver Water and consulting firm Riverside Technology on a report released in March by the Water Research Foundation. It examines the potential impacts of climate change on water supplies in Colorado’s populous Front Range region, using two different hydrology models. The NCAR-based Colorado Headwaters project is also producing new detail on how precipitation may evolve in the high mountains that feed the Colorado River. (See ”Three state of water.”)
Colorado offers a useful window into the complexities of water projections, according to Brad Udall. He directs the Western Water Assessment, one of NOAA’s seven Regional Integrated Science and Assessment groups.
“We get affected by weather from all points on the compass,” says Udall. “We’ve got these big mountains and summer monsoonal flow. All of these things are difficult to resolve in our current models.” Stir in climate change, and this detailed portrait morphs into a motion picture. “When a lot of people talk about climate change adaptation, they say, Give me a target and I’ll plan for it. That doesn’t appreciate the fact that the target is going to move throughout the 21st century.”
As a rule, says Udall, “We don’t deal very well with moving targets.”

Kevin Trenberth (©UCAR. Photo by Carlye Calvin.)
The world’s most comprehensive program to outline the flow of heat and moisture through Earth’s atmosphere is heading in new directions. Formerly the Global Energy and Water Cycle Experiment, GEWEX is now Global Energy and Water Exchanges. Adopted in July, the new name reflects the broadening nature of the group’s work.
“We recognized that the old name was obsolete—we are no longer an experiment,” says NCAR’s Kevin Trenberth, who chairs the GEWEX scientific steering group.
GEWEX is in its 25th year as part of the World Climate Research Programme, with an international project office supported by NASA and located in Silver Spring, MD. Drawing on support from a variety of participating nations, GEWEX fosters collaborative field projects, workshops, dataset development and assessment, and other activities to bolster research on water and energy cycles, with the ultimate goal of reproducing and predicting global hydrologic processes and their effects.
As part of an overall revamp of the parent program toward research that supports climate services, GEWEX has adopted a new set of seven imperatives, as well as four grand science questions: