Mapping hurricane vulnerability
Inland flooding and winds factor into a new database for emergency responders
Aug 17, 2012 - by Staff
Temporary impacts to NSF NCAR Road, Parking Lot and Trails
View more information.Aug 17, 2012 - by Staff
August 17, 2012 | When a hurricane hits, the first concern of emergency responders is often coastal communities. Yet a 2000 study found that 63% of hurricane-related deaths occur in inland counties, often as the result of intense rain, flooding, mudslides, and tornadoes.
To help emergency managers better protect inland communities, NCAR scientists are pinpointing vulnerable populations by studying the reach of tropical storm winds and combining census data with flood maps.
Dereka Carroll, a protégé in NCAR’s SOARS research program, is working with NCAR scientists James Done and Dave Ahijevych to attack this problem. Her first step was assessing how far inland hurricanes and tropical storms can produce strong winds as they weaken. Hurricane Floyd in 1999, for example, produced intense winds 1,300 miles (2,100 kilometers) inland while weaker tropical storms have generated damaging winds as far inland as 600 miles (980 kilometers).
For Carroll’s next step, she wanted to assess deaths caused by inland flooding. Unfortunately, sufficient data didn’t exist. Yet in the waning days of her summer internship, visiting scientist Gabriele Villarini helped fill these vital gaps in the project with his maps of flood-prone inland areas spanning from Texas to the East Coast.
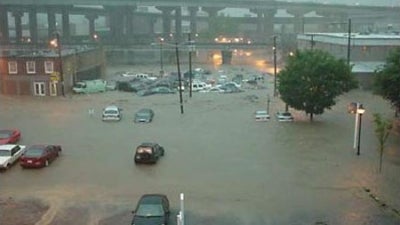
Parts of downtown Richmond experienced major flooding on August 30, 2004, as torrential rains from Tropical Storm Gaston moved inland across Virginia. (Photo courtesy Richmond Times-Dispatch.)
Carroll then compared these factors with national census data and social vulnerability studies, looking at such factors as income and education levels, ethnicity, and age. Census data showed that 36.7% of Americans 65 and older had a disability, either cognitive or ambulatory, which meant they would be especially vulnerable to hurricane hazards.
To produce an overall index, Carroll scored each of the factors between 0 and 1. Males received a higher risk rating than females, for instance, because statistics show that, for reasons not yet understood, more than 71% of those who die in floods during tropical storms and hurricanes are male.
Other factors Carroll took into account included building design (mobile homes are especially vulnerable); the clarity and accessibility of local and state emergency management websites; and population density, which can affect how quickly an area could be evacuated.
Once the factors were totaled, most counties scored between 2.0 and 4.8 on a scale of 1 to 10. Among the findings that stand out: Arkansas has one of the highest vulnerability ratings for hurricane damage, even though it sits hundreds of miles inland.
Carroll’s hope is that the database will allow emergency managers to more effectively allocate resources where they are most needed. This will avoid situations where the same type of assistance is sent to two highly vulnerable counties, when in fact one may need, for instance, more ambulances to assist the elderly, while the other might require translators for a larger non–English-speaking population.
”We want emergency managers to use this in a situation where, if they see the storm track going through a particular area, they can look at those locations and assess their vulnerability all the way down to each individual factor,” Carroll says.
Dereka Carroll, James Done, David Ahijevych, Gabriele Villarini, "Mapping Social Vulnerability to Landfalling Hurricanes in the Atlantic Basin" 2012: unpublished poster presentation: PDF