Now you see El Niño, now you don’t
The tropical Pacific is keeping us in suspense
Sep 28, 2012 - by Staff
Temporary impacts to NSF NCAR Road, Parking Lot and Trails
View more information.Sep 28, 2012 - by Staff
Bob Henson • September 28, 2012 | In recent months there’ve been hints of an El Niño on the horizon that might help quench the ongoing U.S. drought. But those hints might turn out to be as meaningless as a mirage on a parched highway. Though the waters of the eastern tropical Pacific did warm slightly this summer, the region is now sending mixed signals, and what will happen this winter remains uncertain.
Update (October 4):
NOAA's latest ENSO Diagnostic Discussion (see PDF), issued today, retains the El Niño Watch in effect since June. Signals remain mixed, with borderline El Niño conditions now prevailing. There are some hints that El Niño conditions might strengthen over the next few months, but according to NOAA, most models project either a weak El Niño or neutral conditions.
From 2010 through early 2012, La Niña (El Niño’s counterpart, a cooling of the eastern tropical Pacific) prevailed. It was one of the prime influences at work during the intense Texas drought of 2011 and the more widespread U.S. drought this year.
As evident in the map below, La Niña boosts the odds of drier-than-average conditions from California to the Deep South. In contrast, El Niño raises the odds of wetter-than-average conditions across the same area, so many residents would welcome its arrival.
Since around April, the tropical Pacific has been in the “neutral” range, based on the official definition: sea surface temperatures within 0.5°C of average in the region dubbed Niño3.4 (map). For an El Niño, the readings must be above this range when averaged over at least three months.
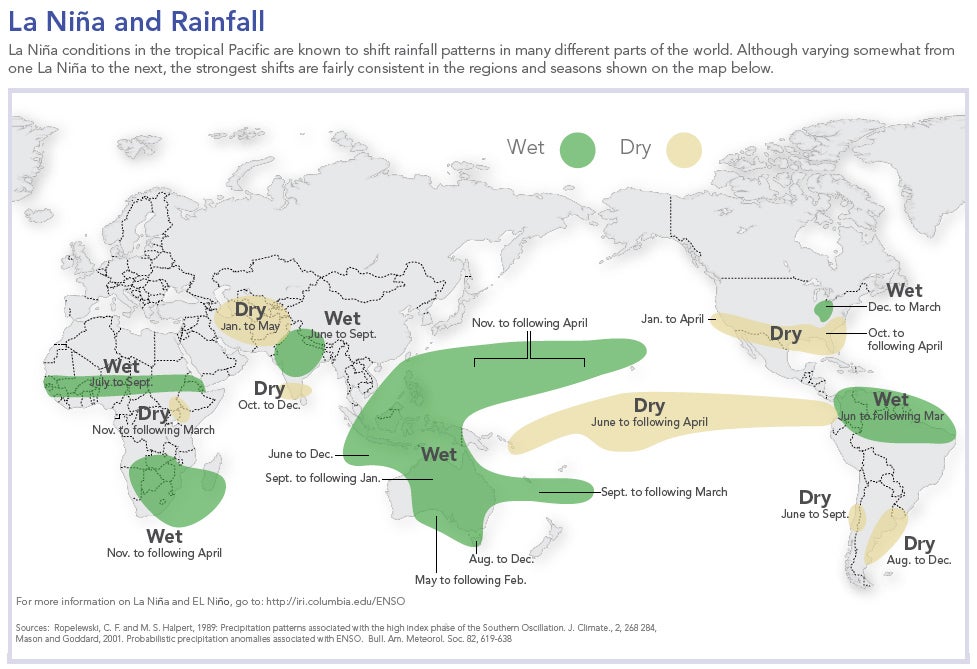
This map is excerpted from a global portrayal of the changes in precipitation commonly observed during La Niña. (Image courtesy Earth Institute, Columbia University.)
Measured on a weekly basis, the Niño3.4 ocean temperatures did rise into El Niño territory for a few weeks this summer, but just barely. They’ve since dipped back below the threshold (see graphic below).
Although the tropical Pacific is in a neutral state about half the time, these periods seldom last long. They usually occur in the spring or summer en route to either El Niño or La Niña in the following fall and winter. “I think of it as a sine wave,” says NCAR expert Kevin Trenberth. “The typical journey is one where the system is racing from one phase to the other.”
One reason El Niño and La Niña are so hard to predict is that they typically evolve through a complex interplay that involves both ocean and atmosphere. As the Niño3.4 waters warm up, for example, the atmosphere often shifts into a circulation pattern that weakens trade winds and reinforces those warm readings. But the winds this summer over the tropical Pacific haven’t responded to the warming oceans as expected—which complicates efforts to see what’s in store this winter.
As nicely explained by IRI (the International Research Institute for Climate and Society), forecasters rely on two kinds of models to predict El Niño and La Niña.
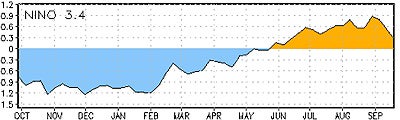
Sea surface temperatures in the Niño3.4 region of the eastern tropical Pacific rose during much of 2012, but the climb has stalled in recent weeks, as seen in this graphic released on September 24 as part of NOAA's Weekly ENSO Update. Temperatures are shown in degrees Celsius. An El Niño is declared when the Niño3.4 readings average 0.5°C or higher for at least three months. (Image courtesy NOAA Climate Prediction Center.)
The most challenging interval for prediction is northern spring, the most likely time for a new El Niño or La Niña to begin taking shape. According to IRI, “once an episode has developed in early northern summer, forecasting its evolution through the remainder of its life cycle is not difficult.”
However, as noted above, 2012 hasn’t evolved in the usual way.
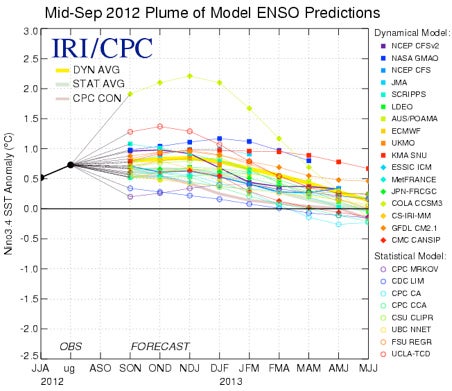
The most recent statistical and dynamical model results are shown in this joint product of the International Research Institute for Climate and Society and NOAA's Climate Prediction Center. (Image courtesy IRI.)
The IRI’s latest monthly update, shown at left, was issued on September 20. More than 80% of models now call for El Niño. But as the report notes, “very few predict more than a weak event.” The split between dynamical and statistical models remains, though it’s less strong than before.
NOAA will issue its next monthly El Niño advisory on Friday, October 5. For now, an El Niño Watch issued in June remains in effect (see September 6 PDF).
However, the latest weekly NOAA update (see September 24 PDF) paints a weakening picture. Temperatures in the Niño3.4 region have dipped to 0.3°C, and the amount of extra heat in the upper part of the eastern tropical Pacific, as measured by warm temperature anomalies, has dropped by more than 50% since August.

Kevin Trenberth (©UCAR. Photo by Carlye Calvin.)
“It sure looks like this El Niño attempt is petering out,” says NCAR’s Trenberth.
There’s still time for the Madden-Julian Oscillation to come to its rescue. About every 30 to 60 days, the MJO produces a batch of showers and thunderstorms that move eastward from the Indian Ocean along the Equator. (NCAR scientists and colleagues recently studied this process.) These MJO pulses can help reinforce westerly winds that keep warm water in place across the eastern tropical Pacific.
“It only takes one MJO event to kick off a major El Niño,” says Trenberth. “That is still possible, if not looking likely.”
Other factors are also in play. The Interdecadal Pacific Oscillation (IPO), which affects ocean temperatures as well as North American climate, has been in a cold (negative) phase since around 1999. This tends to work in ways similar to La Niña, fostering drought across the western and central United States, according to Aiguo Dai (now at the University at Albany, State University of New York). Thus, any El Niño that does develop might face countervailing influences from the IPO, though these interactions are poorly understood.
There’s another elephant in the room: the long-term influence of greenhouse gases. “In my view, El Niño and La Niña are very likely changing as a consequence of climate change, but such changes cannot be measured when you get only one event every three to seven years,” says Trenberth. “The natural variability is enough to make it is impossible to determine a climate change signal.” Still, he adds, when it comes to El Niño and La Niña, it’s best not to assume that past performance is any guarantee of future results.