A more perfect storm
Sandy could make U.S. history
Oct 25, 2012 - by Staff
Early closure on July 3 and 4 - NSF NCAR Road, Parking Lot and Trails
View more information.Oct 25, 2012 - by Staff
Bob Henson • October 25, 2012 | It’s a scenario that seemed outlandish just days ago. But it now looks as if Hurricane Sandy will likely pummel the mid-Atlantic coast early next week. Technically, Sandy may not be classified as a hurricane by that point (I'll ponder that question in a future post; here, let's call it Sandy for convenience). Nevertheless, this storm is in a position to carve out multiple niches in U.S. weather history while producing what could easily be billions of dollars in damage.
What makes Sandy so unusual? And how might it rewrite weather history?
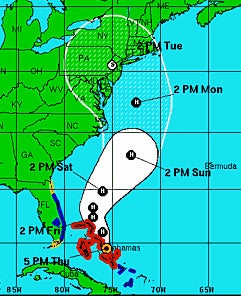
The National Hurricane Center's official forecast issued at 2100 UTC (5:00 p.m. EDT) on Thursday, October 25, shows Hurricane Sandy snaking its way across the western Atlantic before striking New Jersey early on Tuesday, October 29. (Image courtesy NHC.)
As I write, Sandy is in the Bahamas as a Category 2 hurricane, stronger than expected, and projected to move northeast from the Bahamas, as hurricanes so often do. But then—thanks to a strong upper-level storm dipping into the eastern U.S., and an extremely strong center of high pressure toward Greenland—the storm is expected to take a grand counterclockwise loop and arc northwest, which would bring it to the U.S. coast by Tuesday and drive it well inland.
The official National Hurricane Center forecast issued at 5:00 p.m. EDT Thursday (see map at right) has the center of Sandy making landfall early Tuesday in New Jersey while moving toward the northwest. To say this path would be unusual is a major understatement. Few if any hurricanes in the last 100 years have struck the mid-Atlantic or New England with quite such a dramatically hooking path (which resembles a big question mark, as several forecasters have noted).
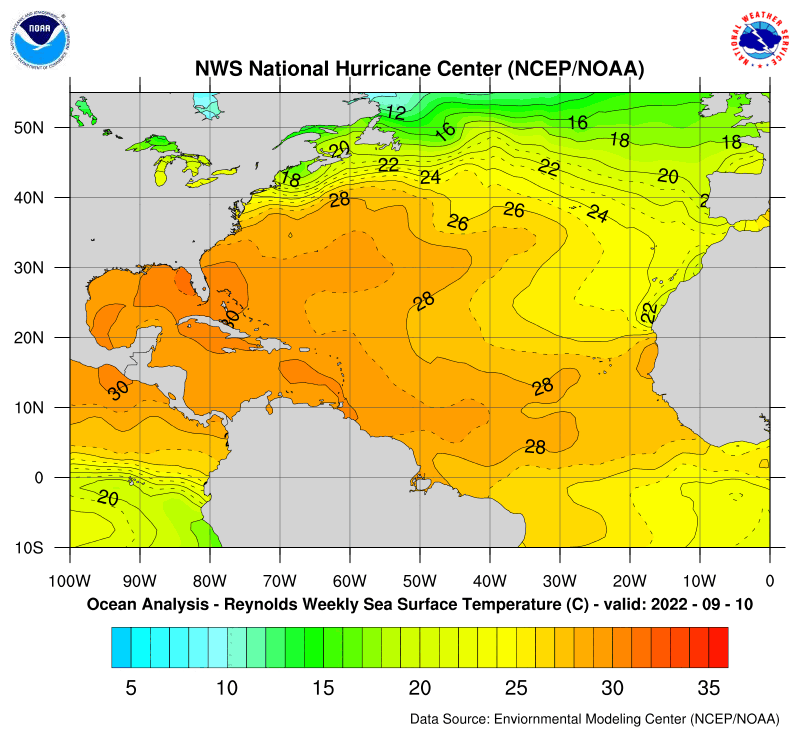
Unfortunately, this curving path would also maximize Sandy’s time close to the warm waters of the Gulf Stream. As shown in NHC's weekly sea-surface map, temperatures are running 1-2°C above average off the mid-Atlantic coast.
Update | 30 October: Sandy's path indeed hooked—in fact, even a bit more sharply than indicated in this forecast graphic. The storm moved west-northwest into Atlantic City, New Jersey, and took a due-west course not long afterward.
Leading forecast models are producing spectacularly low pressures at the center of Sandy. Here are several results from this morning’s 1200 UTC runs for approximate projected intensity in hectopascals at or near landfall. Note that 945 hPa is close to 28.00 inches of mercury on a home barometer.
|
|
GFDL GHM ECMWF NOAA GFS |
928 hPa 936 hPa 944 hPa |
central NJ, Tuesday AM Delmarva peninsula, Monday PM Long Island, Tuesday PM |
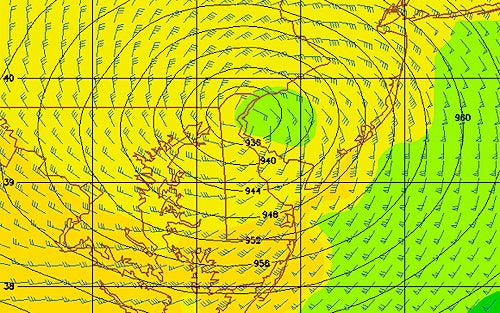
This forecast panel from the NOAA Geophysical Fluid Dynamics Laboratory hurricane model (GFDL GHM), issued at 1200 UTC on Thursday, 25 October, shows Hurricane Sandy producing record-low barometric pressure near Philadelphia on Tuesday, 30 October. (Image courtesy NOAA.)
While a couple of hurricane landfalls in Florida have produced pressures in this range, most cities in the Northeast have never reached such values, as is evident in this state-by-state roundup. The region’s lowest pressure on record occurred with the 1938 hurricane at Bellport, Long Island (946 hPa).
As noted by Weather Underground’s Jeff Masters, the landfall pressures with Sandy may be less extreme than predicted, because of known model difficulties in handling tropical systems moving into midlatitudes. However, all-time records could still be well within reach at some locations.
Update | 30 October: Sandy's landfall air pressure at Atlantic City—946 mb—tied the 1938 record mentioned above. The storm set all-time records for low pressure at Philadelphia, Baltimore, Harrisburg, and a number of other locations.
Sandy’s hooking path and low pressure will help funnel mammoth amounts of seawater toward the Atlantic coast north of wherever the center makes landfall. Thanks to the massive high pressure to the north, and a separate low pressure center far to the east, models project a ribbon of easterly winds all the way from Europe to the mid-Atlantic as Sandy approaches. In addition, there’s a full moon on Monday afternoon, which will exacerbate any storm tides. All of these factors should help strengthen a rare and powerful wave- and surge-generating machine.
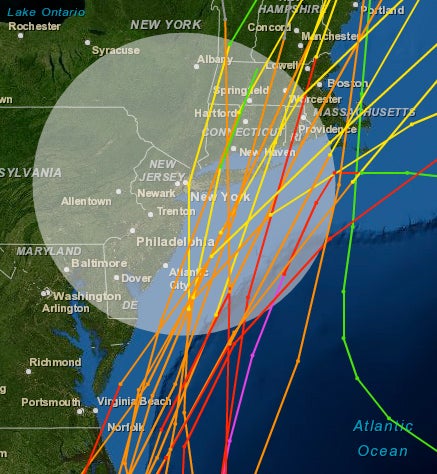
Of the hurricanes ranked Category 2 or greater that have moved within 200 nautical miles of New York City since the 1850s, none are known to have taken a westward hook of the type indicated for Sandy. The hook raises the odds that water will be pushed perpendicular to the coastline, as opposed to more common paths that often parallel the coast. (Image courtesy NOAA Historical Hurricane Tracks.)
The closest recent analog in this realm may be the late-October system of 1991 dubbed "the perfect storm" and made famous in the book and movie of the same name. This was a nontropical winter-type storm southeast of the Canadian Maritimes that absorbed the remnants of Hurricane Grace and arced west. Fortunately for North America, it veered back eastward before making landfall. However, it still produced waves of 10 to 30 feet from North Carolina to Nova Scotia, with tides as high as 14 feet in Boston and a record 7.8 feet in Ocean City, Maryland.
It's worth noting that the surface pressures with Sandy are predicted to be substantially lower than for the 1991 storm (972 mb). Moreover, Sandy is expected to actually make landfall.
New York City is at particular risk for serious impacts from storm surge. If Sandy moves inland on the New Jersey coast, huge amounts of water will flow toward New York’s harbor, so predictions of storm surge will be critical. NOAA is now issuing surge predictions for landfalling hurricanes using a probabilistic, ensemble-based approach. And at the Urban Ocean Observatory of the Stevens Institute of Technology, Philip Orton and colleagues are using the New York Harbor and Ocean Observing System (NYHOPS) to produce surge forecasts based on the NAM model.
“I am personally very concerned about storm surges in New York City,” says Orton, who’s blogged on the topic. He’s working to quantify the longer-term threat with the Consortium for Climate Risk in the Urban Northeast. “City managers and scientists agree that we’re not ready for a 100-year flood event, in major part because we haven’t had one in well over 100 years," Orton says.
Inland flooding is also a serious threat with Sandy. NOAA guidance and recent model runs suggest that 5–10” of rain could fall along and near the storm's path. Heavy snow is even possible along some of the highest terrain of the Appalachians.
Update | 30 October: Needless to say, the concerns about Sandy's storm surge were well founded. With the surge peaking near high tide, New York City experienced water levels of 13.81 feet at the Battery, not only breaking the official 1960 record of 10.5 feet from Hurricane Donna but also topping the 11.2 feet observed in an 1821 hurricane.

University of Wyoming researcher Eric Debenham launches a radiosonde during a 2003 field study. Hundreds of extra radiosondes will be launched across the nation over the next several days to help nail down Sandy's path. (©UCAR. Photo by Carlye Calvin. This image is freely available for media & nonprofit use.*)
Perhaps the biggest potential threat from Sandy for millions of people inland is the risk of power outages and tree loss. Winds may not be sustained above hurricane force, especially inland, but strong gales of 50–60 mph with higher gusts could easily stretch across a vast swath of the most heavily populated part of the country. These winds may be enough to bring down many trees and power lines, especially when accompanied by soil-loosening rains. If enough utility customers are affected, it could take days if not weeks to restore power to some areas—potentially affecting the November 6 elections.
As this threat builds, NOAA has planned an unprecedented array of extra observations. Radiosondes (weather balloons) are normally launched twice a day, at 00Z and 12Z UTC, from nearly 100 points across the United States. Starting today, the National Weather Service will launch extra balloons at 06Z and 18Z, nationwide at first (to capture an evolving storm now over the western U.S. that will steer Sandy), and then focusing on the eastern U.S. into early next week.
“While we have run extra soundings in the past, we have never done this for the entire continental U.S.,” Louis Uccellini told me. Uccellini is director of NOAA’s National Centers for Environmental Prediction. “Doing this on such short notice is an indication of how seriously the NWS views the potential threat from this system, especially as it relates to coastal inundation, flooding from heavy rains, and the like.”
In addition, the GOES-14 satellite will be collecting special imagery above Sandy at 1-minute intervals until the storm dissipates or makes landfall. Refresh these maps (Colorado State University) to see loops of the 1-minute data.