The hybridization of Sandy
How a superstorm came to be
Nov 2, 2012 - by Staff
Temporary impacts to NSF NCAR Road, Parking Lot and Trails
View more information.Nov 2, 2012 - by Staff
Bob Henson • November 2, 2012 | Every so often, a quiet corner of research suddenly grabs the spotlight. Such was the case this week when a Category 1 Atlantic hurricane that killed dozens and caused major destruction in Haiti morphed into Superstorm Sandy, wreaking tens of billions of dollars in damage and taking scores of lives in the eastern United States.
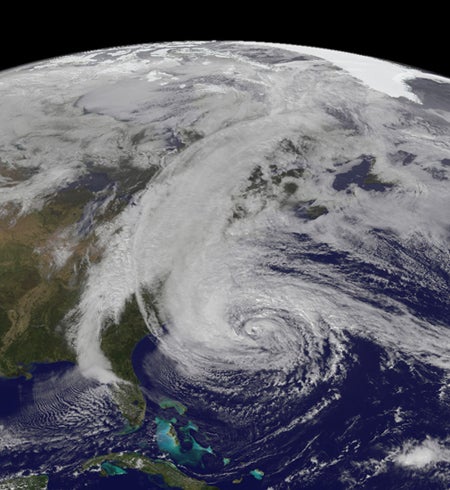
While still a hurricane on Sunday afternoon, October 28, Sandy was already beginning to show extratropical characteristics, including strong winds far north of its center and a huge outflow plume stretching from the southeast U.S. coast into eastern Canada. (GOES-13 image courtesy NASA Earth Observatory.)
Sandy’s destiny as a hybrid storm was flagged to the public several days before landfall, when the irresistible name “Frankenstorm”—coined by a NOAA meteorologist—went viral. (Of course, in the original Mary Shelley novel, it was the scientist rather than the monster who was dubbed Frankenstein, as Bay Area meteorologist Jan Null pointed out to me.)
While there have been hybrid storms before, Superstorm Sandy was a creation distinct in meteorological annals, as it pulled together a variety of familiar ingredients in a unique way. Sandy could be the storm that launches a thousand dissertations—or at least a few—and some of its noteworthy aspects have implications for hurricane warning in general. Warning: there’s a bit of unavoidable weather geekery in the material below, although I’ll try to keep it as accessible as possible.
Extratropical transition is the formal name for what happened in the 12 to 24 hours before Sandy crashed ashore near Atlantic City on Monday evening, 29 October. “Extratropical” means “outside the tropics,” so technically speaking, it would apply to any cyclone (low-pressure center) that’s located in the midlatitudes or polar regions. But there’s a more basic distinction used by meteorologists: whether a low is warm-core or cold-core.
A hallmark of tropical cyclones (known as hurricanes, typhoons, or cyclones in various parts of the world) is that their circulations revolve around a core of warm air. Hurricanes draw energy from oceanic heat and moisture, and they thrive when the surrounding air is uniformly warm and humid and upper-level winds steering the storm are relatively weak. In contrast, an extratropical low is typically positioned at or near the intersection of a cold front and warm front. Such a low is helped rather than hindered by temperature and moisture contrasts and the accompanying strong winds of the polar jet stream.
Here are three of the routes that warm- and cold-core systems can take as they evolve:
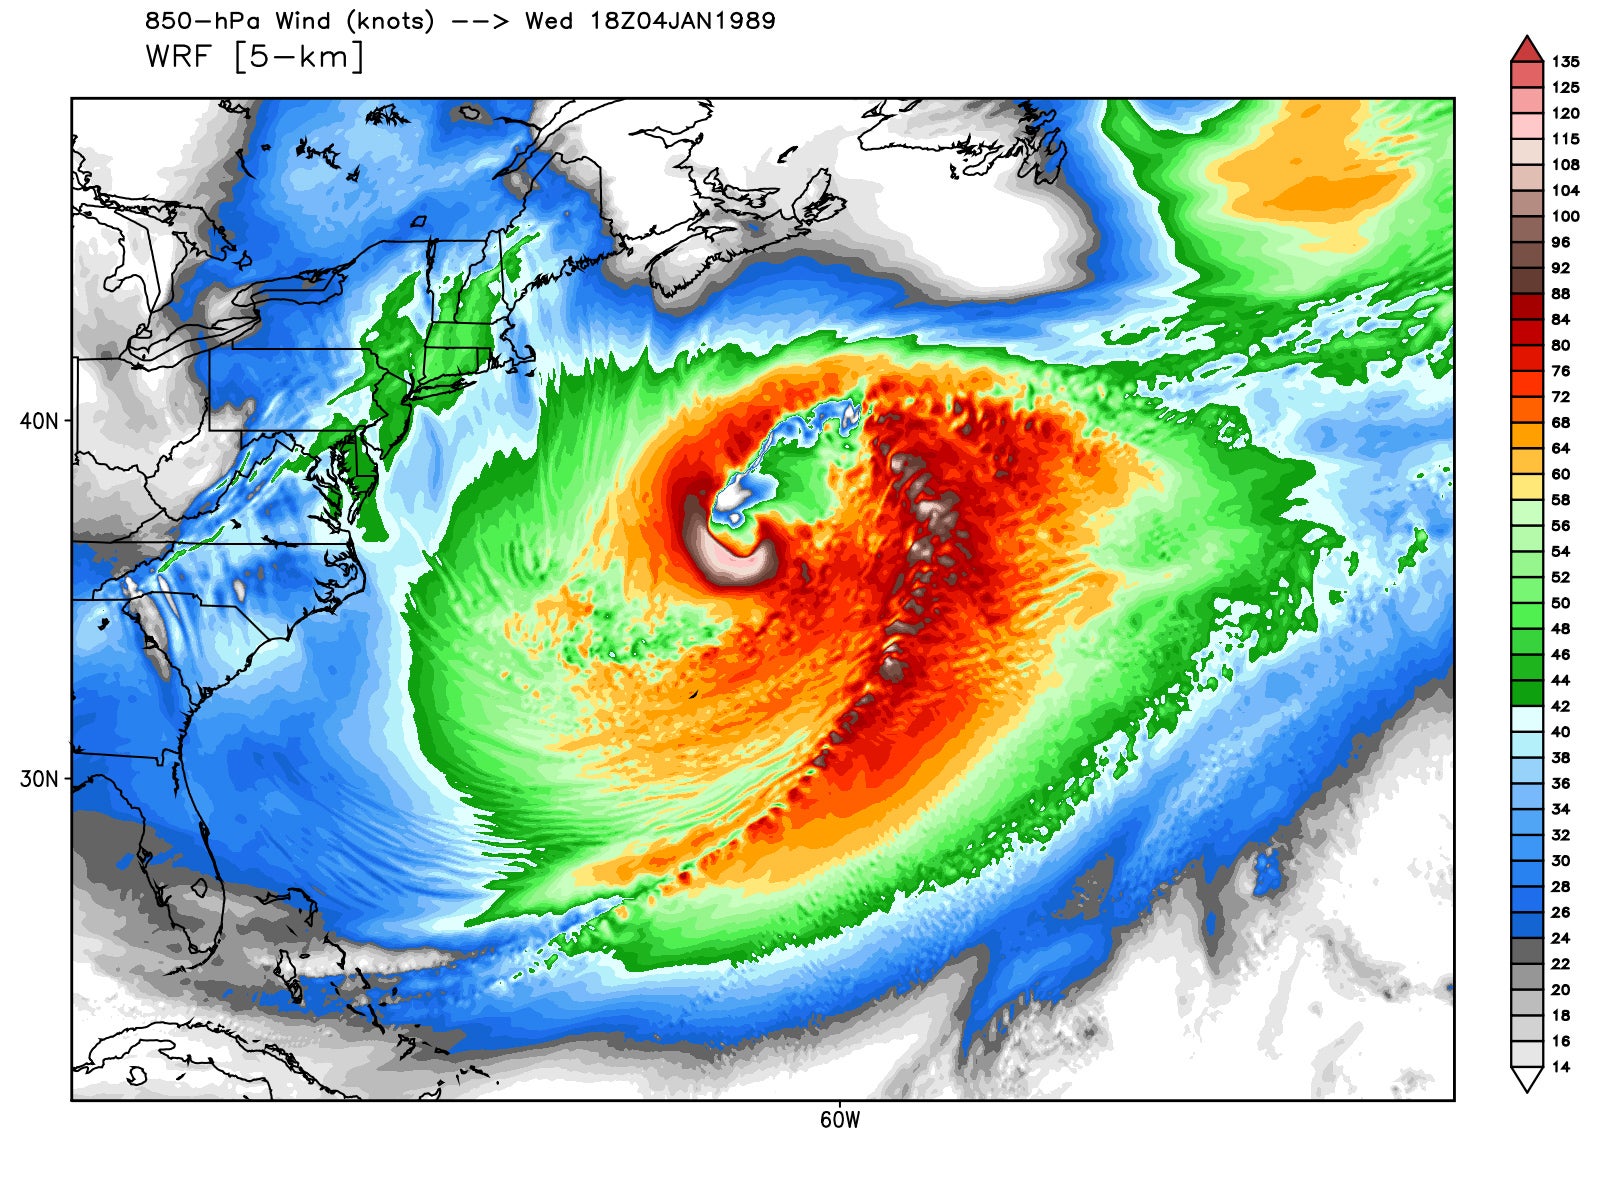
One of the strongest extratropical lows in Atlantic history occurred in January 1989 during the ERICA field project. It was one of the most intense wintertime storms ever observed in that region: air pressure at the surface dipped as low as 928 millibars (27.40 inches of mercury), comparable to the pressure in a Category 3 or 4 hurricane.
The graphic above shows winds at the 850 hPa level, about a mile above the sea surface, with a warm seclusion visible as an eye-like feature on the west side of the storm. (Click on image for an enlarged version, including wind speed legend.)
The YouTube visualization linked below illustrates the evolution of this cyclone.
(Image above courtesy Ryan Maue, WeatherBell; visualization below by Mel Shapiro and Alan Norton, NCAR, and Ryan Maue.)
Meteorologists are still parsing the maps, but it appears that Sandy may have incorporated elements from all three of the above processes. While Sandy was still a hurricane, the storm’s outer edges began to reveal some aspects of an extratropical cyclone, with an enormous zone of strong surface wind and “a great chimney of upper-level outflow,” as Shapiro puts it (see satellite image.) The storm’s warm core briefly intensified about a day before landfall (see diagram).
Then, a few hours before landfall, Sandy began a sharp curve toward the west, moving toward the heart of the approaching midlatitude trough of low pressure. In Shapiro’s view, this marked an apparent warm seclusion trying to take place on top of the storm’s fast-decaying warm core.
I asked Shapiro how often he’s seen a storm like Sandy. He replied, “Never.”
The one that may come closest in Shapiro’s view is the “Long Island Express” hurricane of 1938, which killed hundreds of New Englanders as it slammed ashore virtually without warning. “There was a dramatic upper trough coming in from Canada, just like there was with Sandy,” says Shapiro. The 1938 storm reportedly raced northwards at speeds of close to 70 mph, making it the fastest-moving hurricane on record, and hooked northwest after landfall. While not as much of a speed demon, Sandy did accelerate to a forward motion of nearly 30 mph as it curved west and approached New Jersey. Upper-air observations from the 1930s are sparse, however, so it might not be possible to pin down the commonalities between the two events.
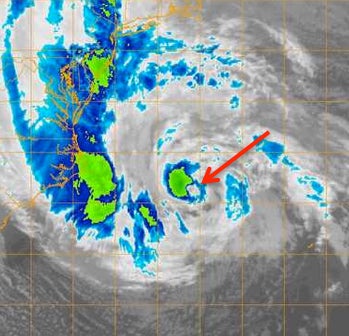
At 0245 UTC on Monday, October 29—about a day before Sandy struck New Jersey—the storm began carving out a thin eyewall (indicated by red arrow), a sign of hurricane intensification, even as the outer part of the storm increasingly resembled an extratropical cyclone. (GOES-13 image courtesy U.S. Naval Research Laboratory.)
Chris Davis, head of NCAR’s Advanced Study Program, has carried out extensive research on how warm- and cold-core processes interrelate. Like Shapiro, Davis finds Sandy an intriguing case. “It seems to have had a remnant inner core that was somewhat tropical, embedded in a much larger nontropical structure,” says Davis. He notes other cases where a remnant warm core can persist well into a storm’s extratropical life. “You end up with two definable structures at once,” he says. “There was a point where you had a huge arc of cloud over land, but you also had a complete eyewall surrounding the inner core.”
Sandy’s vast wind field provides more evidence for the warm-within-cold theory. Along with a small central core of winds near hurricane force, focused on Sandy’s south side, there was a second maximum of high wind well to the north. It pounded portions of New England with wind gusts as high as 86 mph in Rhode Island. This outer wind band later moved into Long Island and New York City.
This dual wind structure isn’t a common occurrence with hurricanes. Fortunately, computer models predicted the unusual outer band of high wind more than a day ahead of time. And upper-air observations caught its development several thousand feet above ground a few hours before the winds mixed down to the surface. As a result, the National Weather Service provided a specific “nowcast,” putting people in the New York area—especially those in skyscrapers—on alert that dangerous hurricane-force gusts could occur in a window of several hours on Monday evening. Gusts reached 90 mph at Islip, in central Long Island, and 79 mph at John F. Kennedy International Airport, in Queens.
There’s still much to digest about the physics of this remarkable weather event, not to mention the host of societal issues it’s raised. What’s heartening to researchers is that computer models, by and large, predicted many of Sandy’s most unusual features days ahead of time. That gave forecasters confidence in predicting unprecedented impacts to the most densely populated part of the nation, regardless of whether Sandy was dubbed a hurricane, an extratropical storm, a hybrid, or—in the label that now seems to be winning out—a “superstorm.”
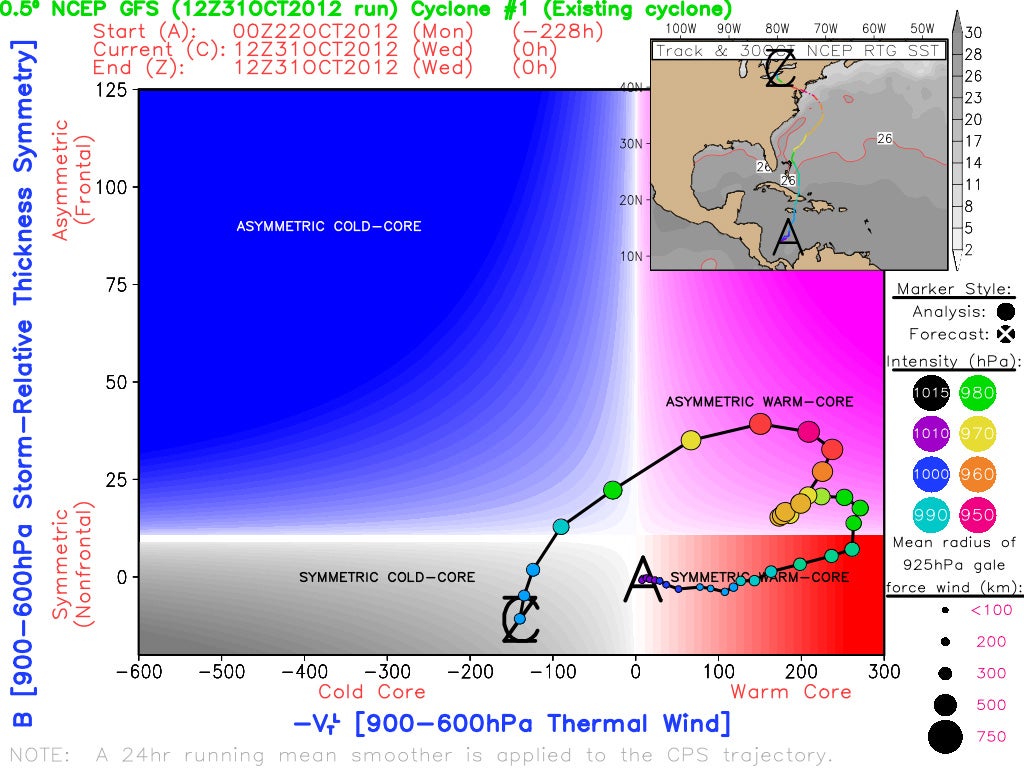
Sandy’s circuitous life: This “phase diagram” from Robert Hart (Florida State University) shows how the storm’s characteristics changed from point A (0000 UTC on October 22, when Sandy was forming in the Caribbean Sea) to point C (1200 UTC on October 31, when Sandy’s remnant low had moved near Lake Erie). Dots are indicated every six hours; warmer colors denote lower pressure and thus a stronger system. Beginning at point A with the structure of a typical hurricane (symmetric warm-core), Sandy became asymmetric as it grew in size. The diagram shows Sandy quickly becoming an asymmetric cold-core low in the 12 hours after landfall and a symmetric cold-core low as it decayed further over the next 24 hours. The kink in the curve at upper right corresponds to the strengthening of Sandy’s inner core about a day before landfall. Click on image to see the full diagram. The phase diagrams are explained in a 2003 article in Monthly Weather Review. Find more background and other phase diagram examples here. (Image courtesy Robert Hart, FSU.)
[Caption revised on 5 November 2012 to clarify timing of Sandy's decay.]