Rough seas
Regional variations add a wild card to future sea-level rise
Sep 3, 2009 - by Staff
Temporary impacts to NSF NCAR Road, Parking Lot and Trails
View more information.Sep 3, 2009 - by Staff
1 September 2009 • Along with unusually persistent rains, there was a different kind of watery surprise this summer for people on the U.S. Atlantic coast. From June into early July, tides ran as high as 60 centimeters (2 feet) above predicted values from the barrier islands of the Southeast to the rocky shores of Maine. Call it an anomalous anomaly: unexpected high tides have been known to strike localized areas on occasion, but this was the first time in modern records that the entire eastern seaboard was battered by so much seawater for so long without explanation.
NOAA issued a technical report on the event in late August, calling out two noteworthy aspects to the large-scale pattern: persistent, long-fetch northeast winds, which helped pile water toward shore, and a weaker-than-usual Florida Current, which feeds into the Gulf Stream.
Even after it faded, the event served as an uncanny foreshadowing of how global change might affect the shores of the northeast United States and eastern Canada. Two recent studies point to the risk that sea levels along this highly populated stretch might rise 1 meter (3 ft) or more beyond the global average. If the ice atop Greenland continues to melt at accelerating rates, then the Northeast could experience higher sea levels still, not just from the meltwater itself, but also from a web of changes in salinity, temperature, and ocean dynamics, all triggered by the freshwater influx.
 As the world considers how to adapt to 21st-century climate change, researchers are acknowledging that a single value of projected sea level doesn't fit all. Satellite data (see sidebar) show that the sea is already rising more quickly in some regions than in others.
Two big question marks—the melting of the Greenland and West Antarctic ice sheets—could exacerbate regional differences greatly. Throw in geologic features, such as the subsidence of river deltas and the slow rebound of once-glaciated land masses, and the true complexity of the ever-rising sea becomes clear.
In a set of papers in the July issue of Nature Geoscience devoted to sea-level rise, Glenn Milne (University of Ottawa) and coauthors encapsulate the problem: "Indeed, one of the few statements that can be made with certainty is that future sea-level change will not be the same everywhere."
Global mean sea level (MSL) isn't a physical constant so much as a concept. For one thing, cold, salty waters occupy less volume than warmer, fresher seas, so MSL tends to be higher near the equator and lower toward the poles. However, trends in temperature and salinity, so-called steric processes, aren't unfolding equally across the globe, because some areas are warming and/or freshening more than others.
Since 1950, the steric contribution to sea level has added as much as 10 cm (4 in) to parts of the northwest Atlantic and Gulf of Mexico, while lowering parts of the northern and tropical Pacific by 5 cm (1.5 in) or more. For the globe as a whole, steric changes made up about half of the rise in sea level from 1993 to 2003, with the rest coming from the melting of ice sheets and mountain glaciers. Data since 2003 hint that the global steric rise may have plateaued, at least temporarily (see below).
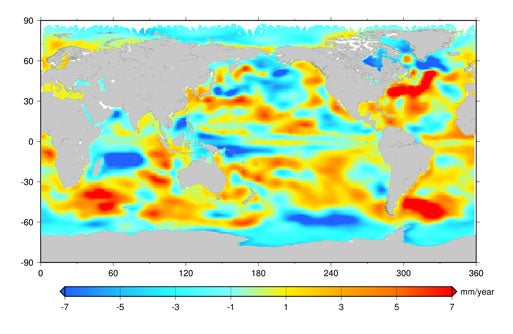 Although Earth’s mean sea level rose by about 7–10 cm (3–4 in) from 1950 to 2003, some parts of the globe actually saw a drop in MSL, as shown in this reconstruction based on tidal gauge data and an ocean model. (Image courtesy William Llovel and the journal Climate of the Past (2009), Llovel et al., Figure 2(b).)
Wind-driven circulations also help elevate the sea in some areas. Persistent trade winds push water from east to west across the tropical Pacific, which spans a third of the globe. That accumulation of water, which warms during its long equatorial trek west, helps make the MSL in the Philippines as much as 60 cm (2 ft) higher than on the south coast of Panama.
Off the east coast of North America, there's a more complex twist to ocean circulation that makes the Atlantic shore especially vulnerable to climate change. Just as a jet stream in the atmosphere separates zones of higher and lower air pressure, the fast-moving Gulf Stream separates areas of differing MSL as it runs up the Atlantic coast. The average MSL to the east of the Gulf Stream is considerably higher than it is between the current and the shoreline. For example, sea level typically runs about 60 cm (2 ft) higher in Bermuda than in New York. "I don't think most people appreciate this fact," says Michael Schlesinger, a professor at the University of Illinois at Urbana-Champaign (UIUC) who has studied sea-level rise since the 1980s.
If the Gulf Stream were to weaken, the difference in sea level on its east and west sides would slacken, thus bringing higher sea levels to the U.S. and Canadian coasts. This could happen through changes in the powerful conveyor belt known as the meridional overturning circulation (MOC), which includes the Gulf Stream. The MOC pulls warm surface water from the South to North Atlantic, where it descends in the far north to form cold, deep water, then completes the loop by flowing southward at depth.
Climate change is expected to slow the MOC by roughly 20-40% by 2100, according to the Intergovernmental Panel on Climate Change (IPCC). While this wouldn't be a catastrophic, cinematic collapse, à la The Day after Tomorrow, even a milder slowdown would lead to a weaker Gulf Stream, with major implications for sea level from North Carolina northward.
These implications hadn't been studied in depth until Jianjun Yin examined them, collaborating with previous advisers Schlesinger and Ronald Stouffer (NOAA Geophysical Fluid Dynamics Laboratory). Yin took a closer look at the modeling carried out in support of the IPCC's 2007 climate assessment, especially the runs performed by GFDL's CM2.1 ocean-atmosphere climate model.
Yin found that the Atlantic's weakening MOC in the GFDL model not only allowed more water to flow toward the U.S. East Coast, but also reduced the formation of cold bottom water, thus warming and expanding the North Atlantic. Together, these dynamic and steric effects could raise New York's sea level by more than 20 cm (8 in) by 2100 under the IPCC's business-as-usual scenario (A2). This finding was robust across other IPCC models as well, according to Yin, who is now a climate modeler at Florida State University. His study was among those appearing in the July issue of Nature Geoscience.
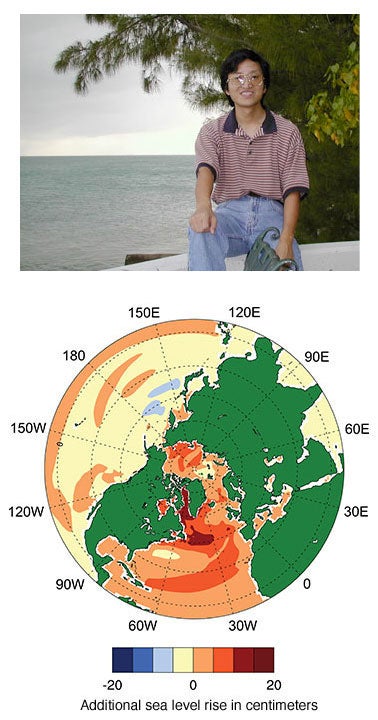 A study in Geophysical Research Letters led by NCAR’s Aixue Hu (above) found that meltwater pouring off Greenland could induce dynamic effects that push sea levels well above those previously calculated for a standard emissions scenario. This graphic shows the added dynamic effects of a 3%-per-year increase in Greenland melt through 2100. (Graphic courtesy GRL, modified by UCAR.)
When melting from Greenland enters the mix, there's an even greater risk of major sea-level rise for the U.S. Northeast. Estimates show that the amount of water streaming seaward from Greenland's glaciers has increased at a rate of 7% per year since the 1990s. The acceleration has stoked fears that the ocean could rise more than previously thought.
In its 2007 report, the IPCC factored in Greenland and West Antarctic ice melt at its 1993- 2003 rates, but specifically excluded what it called "rapid dynamical changes in ice flow" that could further accelerate melting. With that uncertainty to the side, the panel ended up projecting a range of 18-59 cm (7-23 in) of global MSL rise by 2100, depending on how emissions unfold.
The water from Greenland would have regional as well as global effects. NCAR's Aixue Hu (left) and colleagues, including Yin, delved into these using another comprehensive global model, the NCAR- and DOE-supported Community Climate System Model. In a paper published in the 29 May issue of Geophysical Research Letters, they outline a scenario for the east coast of North America that's even more ominous than the one painted by the GFDL model.
Hu found that the MOC could slow by nearly 50% if Greenland's melt rate were to continue increasing by 7% per year. The dynamic changes induced by that slowdown would push up to 50 cm (20 in) of water toward the northeast U.S. coast. On top of that rise, the meltwater itself would directly add another meter or more to sea levels there and elsewhere around the world, though Hu's paper didn't focus on that aspect of the problem.
What if it turns out that Greenland's intense melting over the last few years was just a temporary spike? Hu and colleagues also modeled two more conservative increases in melt rates: 1% and 3% per year through 2100. The weaker of these still leads to a 20-cm (8-in) dynamic rise in sea level along parts of the east coast of North America. "Major northeastern cities are directly in the path of the greatest rise," notes Hu.
Even the melting of ice on the other side of the globe could have disproportionate effects on the U.S. East Coast. The conventional wisdom for years was that a collapse of the West Antarctic Ice Sheet would raise global MSL by at least 5 meters (16 feet). In Science last February, a study led by Jerry Mitrovica (University of Toronto) found that the sea-level boost would actually be higher across the Northern than the Southern Hemisphere, raising MSL an extra 1.3 m (4.2 ft) along the mid-Atlantic, for instance. The reasons: a loss of the gravitational tug from the vast ice sheet that helps keep water pulled toward Antarctica, plus a related shift in Earth's rotational axis and a rise of the newly ice-free land.
Another Science paper in May, led by Jonathan Bamber (University of Bristol), brought down the long-time estimate of global MSL rise from a West Antarctic Ice Sheet collapse to 3.2 m (10.5 ft). However, the paper reiterated the idea that North American coasts would see perhaps 25% more rise than this global average.
With these and other studies throwing new light on the risks from melting ice sheets, there's more pressure than ever to improve estimates of that melt, for instance, by refining the models that link the Greenland and West Antarctic ice sheets to the air above and the ocean below. Two projects are gearing up to do just that.
At LANL, Lipscomb and colleagues have been working to refine two important elements of the CCSM: the Parallel Ocean Program (POP), whose roots go back decades, and the Glimmer ice sheet model, which was recently added to CCSM. Although these ocean and ice models work well with the CCSM's atmosphere model, the three aren't quite as interactive as Lipscomb and others would like. For example, most of the West Antarctic Ice Sheet sits atop land that's below sea level. If warming oceans managed to melt ice at the underwater grounding line, says Lipscomb, "you could lose a substantial amount of ice in a few decades. We don't yet have any coupled ice sheet/ice shelf/ocean models. Developing such a model is one of our goals."
HYPOP, an enhanced version of POP already in the works, will help model the ocean circulation unfolding below the West Antarctic ice shelves and could eventually become part of CCSM. Another advantage of HYPOP is that it allows the mass and volume of the ocean to change, thus making it easier to study steric changes. (At Florida State, Yin is working to link the CCSM with the Hybrid Coordinate Ocean Model, which also allows for varying ocean volumes.)
Ice sheets themselves will get new treatment in the upgraded Community Ice Sheet Model (CISM), now being developed at LANL in collaboration with Johnson and several British researchers. CISM is based on Glimmer but will represent a broader range of ice-sheet behavior, from the slow motions well within an ice sheet to the fast, fluid behavior near coastlines.
"We need a more accurate and complete model for transition regions such as ice streams and outlet glaciers, which could respond to climate change on time scales of decades or less," says Lipscomb. In addition, many of the important processes happen on spatial scales of 10 km (6 mi) or less. Because of this small-scale action, future ice-sheet models will need highly parallel computing schemes, such as those planned for CISM. "We think a model like CISM will give us our most accurate sense of what will happen with ice-sheet dynamics in the next century," Lipscomb says.
As if modeling ocean and ice weren't difficult enough, the land itself poses additional challenges. "When you get right next to shore, things get tricky," says NCAR's Gerald Meehl, who has worked on IPCC climate change projections for many years. Continental shelves, shallow bays, and other fine-scale features make it difficult to pin down localized changes in MSL with precision. "There are a lot of issues with the details of sea-level rise when it comes down to looking at a coastline," Meehl says.
The cragginess of much of the coastline from New England northward could help blunt the impact of disproportionate sea-level rises. In contrast, subsidence and sediment loss add to the vulnerability of flatter coastlines farther south, especially in the Mississippi Delta, where Hurricane Katrina devastated New Orleans and the surrounding lowlying landscape.
"The future of New Orleans is that it won't be there anymore," says UIUC's Schlesinger. Harsh as that sounds, it's consistent with a starkly titled study in the July Nature Geosciences: "Drowning of the Mississippi Delta due to insufficient sediment supply and global sea-level rise." Michael Blum and Harry Roberts (Louisiana State University) found that sea level is rising at roughly three times the rate at which sediment originally accumulated to build the delta over thousands of years. Blum and Roberts project that New Orleans will rest at the tip of a sliver of land jutting 100 km (60 mi) into the Gulf of Mexico by the year 2100.
Parts of Scandinavia are actually watching sea levels fall, a consequence of the land's slow bounceback from the weight of ice-age glaciation. However, the Netherlands, like much of New Orleans, lies well below sea level. A Dutch national committee is taking subsidence into account and planning for worst-case sea-level rises of 2-4 m (6.7-13.3 ft) by 2200. "The economic, societal and physical stakes in the Netherlands are great and growing still," warned the committee in a recent report.
Schlesinger is glad to see regional variations in sea level getting their due. He hopes the nagging uncertainties, still on the order of a meter or more for some areas over the next century, don't inhibit action. According to Schlesinger, "Just because there is uncertainty in the quantitative estimate of something shouldn't mean that we ignore it."
For such a basic part of humanity’s relationship with the ocean, sea level has been surprisingly hard to measure. Tidal gauges have been used at fixed points since the late 1800s, and they’re still invaluable for tracking local trends. However, they can only measure the height of water around the margin of Earth’s vast oceans, and they can’t independently diagnose whether the land on which they rest is rising or sinking.
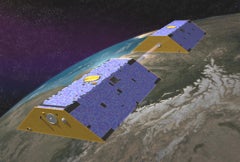 An artist’s conception of the GRACE satellite. (Image courtesy NASA.)
The modern era of sea-level measurements began in 1992 with the launch of TOPEX/Poseidon. This U.S./French satellite included an altimeter that measured sea level below its path to a resolution of 3.3 cm (1.3 in) by gauging the time it took a radar signal to travel to the ocean surface and back. Since then, altimeters have mapped sea level across each part of Earth’s oceans every few days.
Between 1992 and 2007, the data show sea level rising across much of the western Pacific and falling in parts of the northern and eastern Pacific. However, the actual ups and downs likely play out on a variety of time scales. “The trend is merely indicative of the variability to be found,” notes Glenn Milne in the July issue of Nature Geosciences.
By combining altimeter data with other observations, scientists have made progress in distinguishing what’s causing the sea to rise globally and locally. Earth’s gravitational fields have been mapped at high precision since 2002 by the Gravity Recovery and Climate Experiment (see illustration), jointly supported by NASA and Germany’s space agency. GRACE data help quantify how much water is flowing from land and ice sheets into the sea and how mass is shifting within the ocean.
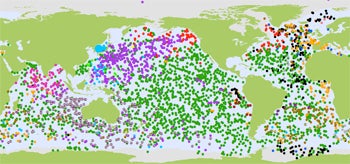 This graphic shows the roughly 3,000 Argo floats contributed by 23 nations as of last April. (Image courtesy Howard Freeland, Institute of Ocean Sciences, Canada.)
As for ocean temperature and salinity, a multinational network of buoys called Argo, launched in 2000, now includes more than 3,000 buoys throughout the world’s oceans (see map). Every 10 days, these floats dip to as low as 2 km (3 mi) before resurfacing, gathering a vertical profile of ocean conditions along the way.
Together, these complementary platforms have opened a new era in MSL research. A French team led by Anny Cazenave combined GRACE, Argo, and altimeter data to find that the MSL rise from 2003 to 2008 was almost entirely due to ice melt rather then steric factors, as the oceans expanded early in the period and then contracted (perhaps due to La Niña). Published last year in Global and Planetary Change, the study pegged the total rise in global MSL for 2003–08 at about 2.5 mm/year. That’s down from the 1993–2003 rate of about 3.0 mm/yr, but still above the 1900–2000 estimate of 1.5–2.0 mm/yr.