The weather year in review: a sneak preview
U.S. leads the world in unusual heat
Dec 12, 2012 - by Staff
Temporary impacts to NSF NCAR Road, Parking Lot and Trails
View more information.Dec 12, 2012 - by Staff
Bob Henson • December 12, 2012 | Though we’re still more than two weeks from the end of 2012, it’s not too soon to get a sense of how the year will go down in meteorological annals. Since one of this year’s themes is seasonal creep (unusually early budbursts in the spring, shopping on Thanksgiving Day), we might as well get ahead of the game.
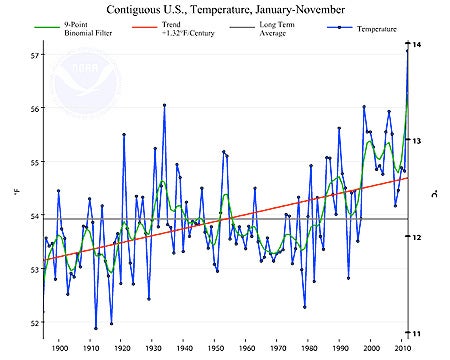
For the January–November period in 2012, U.S. temperatures averaged just over 57°F. That's more than 1°F above the January-to-November value for the previous record-warm year (1934) and more than 3°F above the 118-year average. (Graph courtesy NOAA National Climatic Data Center.)
Last week NOAA released its monthly set of statistics, which allows us to look at the period from January to November. Some of the signals are so strong that December won’t change the outcome.
Looking at the January–November period since records began in 1895, this year is by far the warmest on record for the contiguous U.S. (the “lower 48” states). The average of 57.06°F beats 1934 by a full degree Fahrenheit (see graph at right). More than a dozen runner-up years are less than 1°F behind 1934, which tells you how much of an outlier 2012 is.
Here’s another clue:
as of December 11, NOAA reports that U.S. weather stations across all 50 U.S. states have broken or tied 33,659 daily record highs and only 6,275 record lows. That’s more than a 5:1 ratio, soaring beyond the 2:1 ratio that prevailed in the last decade. (See our short “weather on steroids” video for more on this trend.)
You can’t pin an entire year of warmth on a single culprit, but the Great Warm Wave of March 2012 looms large. As evident in the NOAA graph below, March pushed this year far above its chief rivals, and the benefit of that head start persisted throughout the year.

Unprecedented March heat pushed the year 2012 far above other warm years for the contiguous U.S., and most of that margin persisted through November. The colored lines show where the final tally is likely to end up, depending on December temperatures, which are now running well above average. (Graph courtesy NOAA National Climatic Data Center.)
.
As far as global temperature goes, 2012 hasn’t been quite as much of a standout, although it does sustain the string of warmth that made 2001–10 the warmest decade in at least the last century.
With data available through October, the World Meteorological Organization announced that 2012 was the planet’s ninth warmest Jan-Oct. period in analyses going back to 1850. The La Niña conditions that have waxed and waned since 2010 have helped tamp down global temperatures, so when the next El Niño arrives, a new global record might well be possible.

For the period January to October, much of the globe saw temperatures above the 1981–2010 average. The most anomalous warmth was centered near the Great Lakes, with unusually cool readings hovering over western Alaska. Gray areas indicate where data was unavailable. (Map courtesy NOAA National Climatic Data Center.)
It’s apparent on the map of global temperature anomalies at right that the contiguous United States is the world’s leading hot spot for 2012. Note the blob of blue to the northwest, though—a sign that Alaska is strongly bucking the national trend. Through November, Alaska has seen the 13th coolest year in its records, which go back to 1918.
While this year’s record U.S. heat isn’t a particular milestone for planet Earth, it’s quite significant for climate change politics. Contrarian pundits have long pointed to the persistence of the impressive annual heat record set during the peak of the 1930s Dust Bowl.
That 1934 record was virtually matched in 1998. But a media/blogosphere storm erupted in 2007 when a minor error emerged in NASA’s comparison of the two years. Most researchers emphasized the fact that the 50 United States cover a mere 2% of Earth’s surface, so U.S. temperature signals are only a tiny piece of the pie. In any case, 2012 puts a decisive end to this tempest in a global-warming teapot.
Dryness is another major U.S. weather story for 2012, with a vicious, unyielding drought locked in the nation’s heartland. The states of Colorado, Nebraska, and Wyoming are enduring their driest calendar year on record (see map), and more than half the nation is experiencing some form of drought. There’s no sign of immediate large-scale relief on the way.

Drier-than-average conditions spanned most of the contiguous United States for the period January–November 2012. Among the 118 years of record keeping, this year ranks as the driest for Colorado, Nebraska, and Wyoming, with many other states in the top 20. (Map courtesy NOAA National Climatic Data Center.)
If you’re looking for moisture, try the nation’s soggy edges. Washington is having a top-10 year for precipitation, thanks to a jet stream pointed toward the Pacific Northwest rather than the nation’s heartland. Louisiana and Mississippi are also on the wet side for 2012, thanks in large part to Hurricane Isaac’s lumbering assault in August. And Maine is moister for the year than its New England neighbors.
Of course, there’s much more to discuss in the weather of 2012. I’ll delve into some of the year’s more noteworthy events, including Hurricane/Superstorm Sandy and a record summer for Arctic ice loss, in future posts.