Phenomenon of the year: Sandy’s stunning surge
What made the threat so complex, and so hard to communicate?
Dec 31, 2012 - by Staff
Temporary impacts to NSF NCAR Road, Parking Lot and Trails
View more information.Dec 31, 2012 - by Staff
 [NOTE: This is the first in a two-part post. Part 2, "Dissecting Sandy's surge," analyzes the components of the storm's destructive high water]
Bob Henson • December 31, 2012 | More than two days ahead of landfall, it was clear that Hurricane Sandy could bring higher water to New York and New Jersey than the region had seen in many decades. The extreme risk was evident in projections of storm surge from the National Weather Service and from university research teams. But for many thousands of people from New Jersey to Long Island, the threat simply didn’t register.
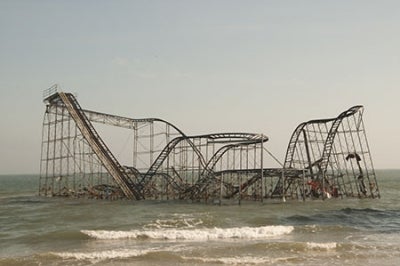
This roller coaster, photographed November 12, 2012, was one of many memorable sights in the aftermath of Hurricane Sandy. An attraction on the Seaside Heights boardwalk in northern New Jersey for 70 years, the coaster was pushed into the Atlantic Ocean by the storm's mighty waters. (Photo by Patsy Lynch, FEMA.)
Why? That’s the question of the year, not only for NWS forecasters but also for broadcast meteorologists and emergency managers. These groups make up the relay team that transfers information on hurricane risk from the minds of forecasters plumbing the depths of computer models into the hands of the public. Often, the relay works brilliantly, but sometimes there are stumbles along the way.
Sandy had its share, a few of which are highlighted in a compelling Weather Channel blog entry posted last week by Bryan Norcross. The Sandy experience also points to issues evident in other recent storms (such as this year’s Isaac), as well as ongoing work by atmospheric and social scientists.
How to best communicate storm surge will no doubt crop up as a key topic on January 7, as the American Meteorological Society holds a special evening town hall session on Sandy at its annual meeting in Austin.
Because surge has so many hard-to-summarize facets, this blog post is a bit longer than usual—but the stakes are high enough that some careful pondering is in order. We’ll look at:
In Part 2, we dive even deeper into the categories and terms that make high water during hurricanes so tough to characterize, yet so important to understand.
Sandy’s projected westward turn ran counter to more than a century of Northeastern history
I talked about surge with the National Hurricane Center’s Jamie Rhome in September, shortly after Hurricane Isaac swept across the central Gulf Coast. We caught up again recently to discuss Sandy. As the NHC’s head of storm surge prediction, Rhome knew that Sandy would pose unique and serious challenges, many of them a function of where the storm was headed.
High tidal range. Rhome points out that the difference between low and high tide along the Gulf Coast is typically only a foot or so. This means the impact of a storm surge won’t be greatly boosted or dampened by tidal effects. As you move northward along the Atlantic coast, tidal ranges grow, reaching five feet in the New York area and up to eight feet in New England. And the switch from high to low tide is twice as frequent—typically every six hours in the Northeast but every 12 hours along the Gulf Coast. As a result, says Rhome, ”The impacts of a hurricane storm surge are going to be much more sensitive to the timing of landfall in New York than they would be in the Gulf of Mexico.”
Dense population. A few weeks earlier, Hurricane Isaac brought a major storm surge risk to the Mississippi Delta. “In the case of Isaac, you could home in on southern Mississippi and Louisiana and work closely with people in that area ,” says Rhome. “With Sandy, there was significant flooding from North Carolina to Cape Cod. You had multiple states with major cities, so it really taxed the system.”
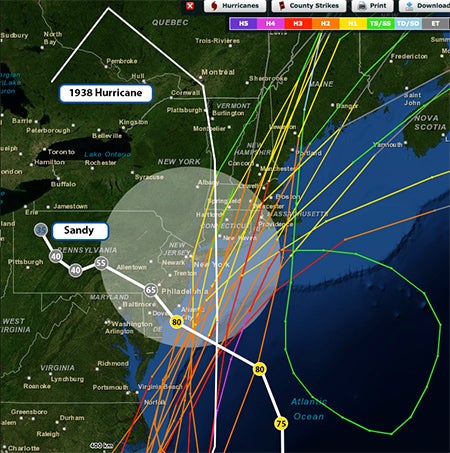
This map shows the track of every hurricane that's been at Category 2 strength or stronger within 200 nautical miles of New York City since 1851. Unlike the other tracks, which generally run from south-southwest to north-northeast, Sandy tracked west-northwest toward New Jersey. The numbers at each point along Sandy's path indicate the storm's intensity in knots (multiply by 1.15 to get approximate miles per hour). Click for larger PDF. (Illustration by Bob Henson and Carlye Calvin, UCAR, based on the NOAA Historical Hurricane Tracks site.)
Irene’s imprint and Sandy’s path. Only a year ago, Hurricane Irene had swept northward into the New York area. Like Sandy, it was a large, lumbering hurricane that posed the risk of devastating surge in the New York area. But Irene moved toward the north-northeast and weakened, whereas Sandy remained powerful and took a virtually unprecedented westward jog—essentially a worst-case trajectory for pushing water from several directions into the densely populated region.
Sandy wasn’t a strong hurricane by Saffir-Simpson standards (it only reached Category 2 for a brief time). And no hurricane warning was issued for the immediate coast, since the storm was expected to lose its tropical characteristics, and thus its classification as a hurricane, just before landfall. As a result, it’s possible many people assumed that Sandy’s impacts would be less than Irene’s.
When it comes to big storms, basing current decisions on past experience has proved to be a frequent and tragic mistake. During 2005’s Hurricane Katrina, hundreds of people who had failed to evacuate the Mississippi Coast were killed. Some who survived said they’d presumed that Katrina could never top the catastrophic surge from 1969’s Hurricane Camille, even though forecasters said it could, and in fact, it did.
Others were dubious about Sandy’s projected westward turn, which ran counter to more than a century of Northeastern history. Apart from the NHC’s immediate duties during a particular hurricane, the center also carries out more general storm surge modeling that helps local areas designate evacuation classes (Zone A, Zone B, and the like) based on expected water height.
“We do include westward-moving scenarios,” says Rhome. But when the NHC released vulnerability maps for one Northeastern city, he adds, some officials resisted. “Folks pushed back and said, It’s impossible to have a westward-moving storm into this area. They wanted me to remove those tracks from the analysis.” Needless to say, he didn’t.

Local and regional emergency managers hit the streets of Allentown, Pennsylvania, to conduct damage assessments soon after Hurricane Sandy swept through the area. (Photo by Elizabeth Stands, FEMA.)
Even without the complications posed by Sandy, storm surge risk is exceedingly difficult to communicate. Among the groups analyzing this challenge is an NCAR-based team of physical and social scientists that includes Jeff Lazo, Rebecca Morss, and Julie Demuth. They’ve been working closely with Betty Morrow (SocResearch Miami) to examine what they’ve defined as the hurricane warning system: the interdependent network made up of specialists at NHC, local NWS offices, radio and TV stations, and local offices of emergency management.
The strengths and weaknesses of this system were scrutinized several months ago in an article for the Bulletin of the American Meteorological Society by this research team, with Demuth as lead author. The work, which involved extensive interviews with people across the system, is part of a series of recent and ongoing studies supported by NOAA and the National Science Foundation that are looking at hurricane warning communications from several angles.
Demuth and colleagues found that, by and large, the members of each group in the hurricane warning system take on complementary roles and respect each others’ expertise. That’s tremendously important, says the team, especially given weaknesses in the system evident in the glare of the post-Sandy spotlight. (Even the NWS’s own assessment of its performance during Sandy became a hot potato as it was launched, put on hold, and then reconstituted.)
Among the concerns highlighted in the interviews:
People don’t understand the violence and speed of storm surge
—Betty Morrow, SocResearch Miami
The team hopes that their findings—which took on added resonance after Sandy—help prompt the key players to set up regular meetings and closer coordination that’s more formalized yet still flexible. Through an NSF rapid response grant, Morrow is also part of a team led by Hugh Gladwin (Florida International University) that’s preparing to interview forecasters, broadcasters, and EMs in the areas struck by Sandy.
Researchers also hope that the NWS strengthens its work with social scientists to evaluate, test, and improve its suite of hurricane products—especially with respect to storm surge, which is still poorly grasped by the public.
“People don’t understand the violence and the speed of storm surge,” says Morrow.
“They tend to think it’s the same as rainfall flooding and that they’ll have a chance to react.”
One place where social science has already borne fruit is a basic but important definition: how high “high water” really is. Such values are expressed against a confusing array of benchmarks (see Part 2 of this post, Dissecting Sandy's surge). And the numbers can vary dramatically if landfall comes just two or three hours sooner (or later) than predicted.
The separate storm surge warning is exactly what our work supports
—Jeff Lazo, NCAR
“This is incredibly difficult to communicate to someone who’s in a hurry when a crisis is unfolding,” notes Rhome.
As reported this month in the New Orleans Times-Picayune, the NHC will soon be issuing storm surge watches and warnings that are parallel but distinct from hurricane watches and warnings. “The separate storm surge warning is exactly what all of our work supports,” says NCAR’s Lazo, who adds: “I think it’s an important step, but it’s only one piece of the process. You can create the warning, but it won’t make a difference unless it’s communicated, understood, and used.”
The NHC will also be producing color-coded maps that show the high end of the potential range of water above ground level—which is, after all, what matters most to a person standing in harm’s way. The maps, says Rhome, are “a classic example of where social science is helping us.”